
Ficheiro:Daily CoViD BD.svg

Imagem numa resolução maior (ficheiro SVG, de 886 × 531 píxeis, tamanho: 23 kB)
|
|
Esta imagem provém do Wikimedia Commons, um acervo de conteúdo livre da Wikimedia Foundation que pode ser utilizado por outros projetos.
|
Descrição do ficheiro
| Descrição |
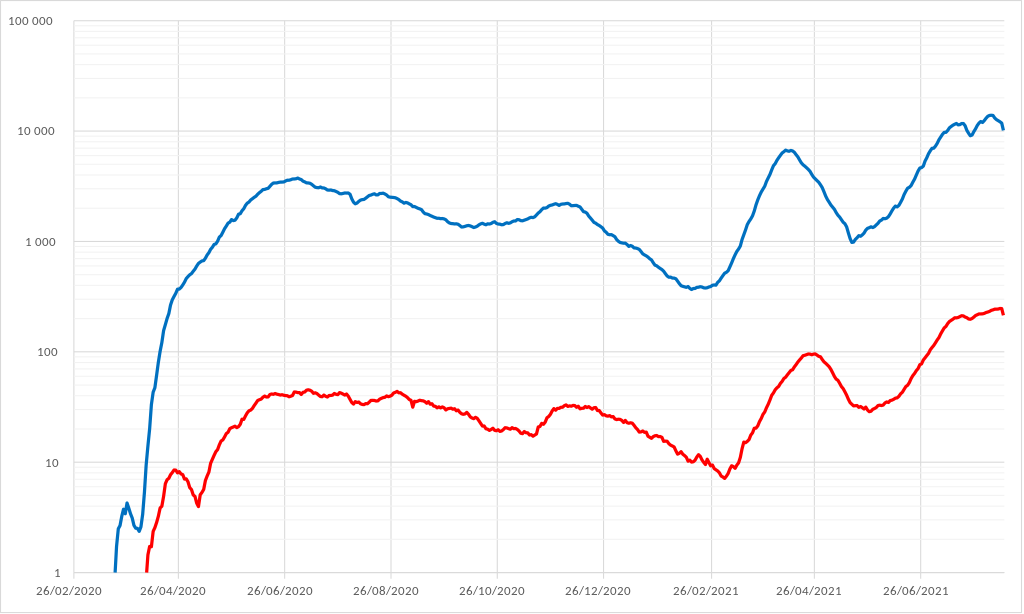
English: Logarithmic plot of detected cases (blue) and deaths (red) from CoViD-19 in Bangladesh, based on numbers reported by World Health Organization Ponderated ten-days mean. |
| Data | |
| Origem | Obra do próprio |
| Autor | Micheletb |
Daily confirmed cases (blue), daily deaths (red) for the CoViD-19. Ponderated mean on ten days (nominal day weights 10, day before 9, and so on up to day ten) which divides by ~10 the daily noise variation in order to underline the medium-term trend.
This chart has been made using the WHO daily reports (see https://www.who.int/emergencies/diseases/novel-coronavirus-2019/situation-reports/). Though countries are committed to report to WHO every day, some country reports are missing, leading to "dents" in the curve. This is caused by messy report and can't really be corrected. Please note that due to time zones and time of report, the figure for a given day according to WHO may not be that of official sources.
The growth and evolution of a pandemic in its initial stage is exponential, meaning that the percentage of increase from one day to another is (roughly) constant. This, in turn, means that in a semi-logarithmic plot, the slope is (roughly) constant, therefore the curve is (roughly) a straight segment. The public health policy is to bend the curve down. A change in the policy or its efficiency leads to a change in the slope.
To describe the pandemic's evolution, a daily report of victims or deaths is not really informative in the aftermath. The relevant description is, where are the slope changes, which indicate a change in the pandemic's regime? Those inflection points are the limits within which the description of what has occurred can be homogeneous.
Licenciamento
- Pode:
- partilhar – copiar, distribuir e transmitir a obra
- recombinar – criar obras derivadas
- De acordo com as seguintes condições:
- atribuição – Tem de fazer a devida atribuição da autoria, fornecer uma hiperligação para a licença e indicar se foram feitas alterações. Pode fazê-lo de qualquer forma razoável, mas não de forma a sugerir que o licenciador o apoia ou subscreve o seu uso da obra.
- partilha nos termos da mesma licença – Se remisturar, transformar ou ampliar o conteúdo, tem de distribuir as suas contribuições com a mesma licença ou uma licença compatível com a original.
Histórico do ficheiro
Clique uma data e hora para ver o ficheiro tal como ele se encontrava nessa altura.
| Data e hora | Miniatura | Dimensões | Utilizador | Comentário | |
|---|---|---|---|---|---|
| atual | 09h51min de 13 de agosto de 2021 | | 886 × 531 (23 kB) | Micheletb | |
| 10h24min de 23 de junho de 2021 |  | 886 × 531 (20 kB) | Micheletb | ||
| 07h40min de 17 de abril de 2021 |  | 886 × 531 (18 kB) | Micheletb | ||
| 11h51min de 20 de março de 2021 |  | 886 × 531 (18 kB) | Micheletb | ||
| 09h09min de 14 de fevereiro de 2021 |  | 886 × 531 (17 kB) | Micheletb | ||
| 18h52min de 11 de janeiro de 2021 |  | 886 × 531 (16 kB) | Micheletb | ||
| 05h40min de 29 de novembro de 2020 |  | 886 × 531 (17 kB) | Micheletb | ||
| 18h29min de 9 de novembro de 2020 |  | 971 × 489 (16 kB) | Micheletb | == {{int:filedesc}} == {{Information |description= {{en|1=Logarithmic plot of detected cases (blue) and deaths (red) from CoViD-19 in Bangladesh, based on numbers reported by World Health Organization [https://www.who.int/emergencies/diseases/novel-coronavirus-2019/situation-reports/. Ponderated ten-days mean.]}} |date=2020-nov-09 |source={{own}} |author={{U|Micheletb}} |other versions= |other fields= }} {{Daily CoViD19 Chart}} =={{int:license-header}}== {{self|cc-by-sa-4.0}} [[Category:Dia... |
Utilização local do ficheiro
A seguinte página usa este ficheiro:
Utilização global do ficheiro
As seguintes wikis usam este ficheiro:
- en.wikipedia.org
- ms.wikipedia.org