
Ficheiro:Butterworth response.png
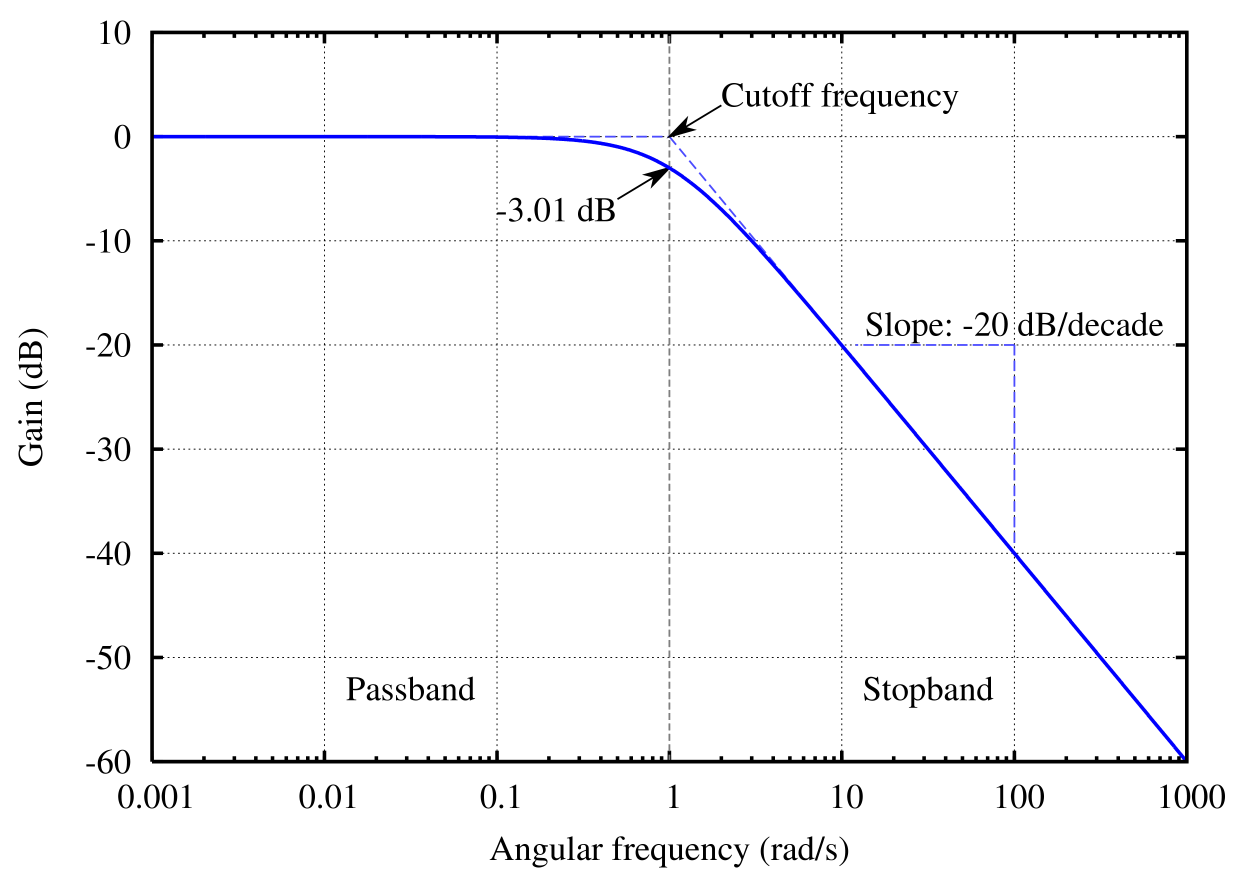
Imagem numa resolução maior (1 240 × 880 píxeis, tamanho: 86 kB, tipo MIME: image/png)
|
|
Esta imagem provém do Wikimedia Commons, um acervo de conteúdo livre da Wikimedia Foundation que pode ser utilizado por outros projetos.
|
Descrição do ficheiro
| Descrição |
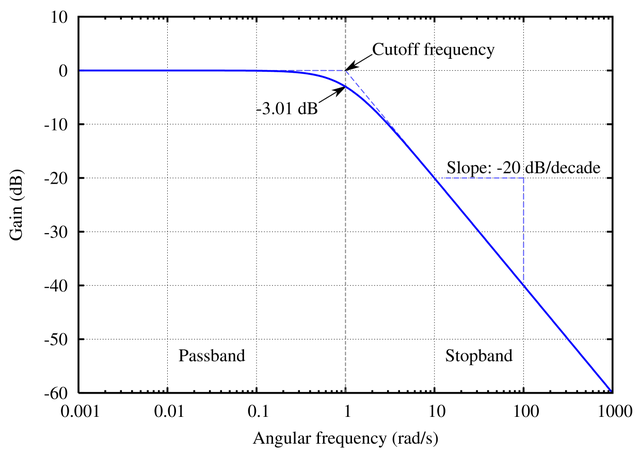
English: The frequency response of a Butterworth filter with logarithmic axes (Bode plot) and various labels. Cutoff frequency is normalized to 1 rad/s. Gain is normalized to 0 dB in the passband.
Many orders on one plot: File:Butterworth orders.png. Version with no text available at File:Butterworth plain.png, though you should probably just modify the source code and regenerate it in your own language. See Wikipedia graph-making tips. Generated in gnuplot with the script below (save as butterworth.plt and then open in gnuplot). Then I opened the butterworth.ps file in a text editor to edit the line colors and linestyles, as per this description. This avoids needing to open in proprietary software, and really isn't that difficult (especially if you don't know the commands in the proprietary software either). ;-) Identify the lines easily by their color (the arrow is currently magenta and I want it to be black. Ah, there is the entry with 1 0 1, red + blue = magenta) or by using the gnuplot linestyle−1. (For instance, gnuplot's linestyle 3 corresponds to the ps file's /LT2.) Then you can edit the colors and dashes by hand. I changed the original: /LT0 { PL [] 1 0 0 DL } def
/LT1 { PL [4 dl 2 dl] 0 1 0 DL } def
/LT2 { PL [2 dl 3 dl] 0 0 1 DL } def
/LT3 { PL [1 dl 1.5 dl] 1 0 1 DL } def
into this: /LT0 { PL [] 0 0 1 DL } def
/LT1 { PL [4 dl 2 dl] 0.5 0.5 0.5 DL } def
/LT2 { PL [6 dl 3 dl] 0.3 0.3 1 DL } def
/LT3 { PL [] 0 0 0 DL } def
/LT4–/LT8 I left unchanged. (I don't know what they're used for anyway.) /LTw, /LTb, and /LTa are for the grid lines and such.To convert the PostScript file to PNG:
|
| Data | 26 de junho de 2005 (data do carregamento) |
| Origem | Obra do próprio |
| Autor | Omegatron |
| Outras versões |
|
| gnuplot source | click to expand
set samples 2001
set terminal postscript enhanced landscape color lw 2 "Times-Roman" 20
set output "butterworth.ps"

# Butterworth amplitude response and decibel calculation.  n is the order, which is just 1 in this image.
G(w,n) = 1 / (sqrt(1 + w**(2*n)))
dB(x) = 20 * log10(abs(x))

# Gridlines
set grid

# Set x axis to logarithmic scale
set logscale x 10

# Set range of x and y axes
set xrange [0.001:1000]
set yrange [-60:10]

# Create x-axis tic marks once per decade (every multiple of 10)
set xtics 10

# Use 10 x-axis minor divisions per major division
set mxtics 10

# Axis labels
set xlabel "Angular frequency (rad/s)"
set ylabel "Gain (dB)"

# No need for a key
set nokey #0.1,-25

# Frequency response's line plotting style
set style line 1 lt 1 lw 2

# Draw a separator between passband and stopband and label them
set style line 2 lt 2 lw 1
set style arrow 2 nohead ls 2
set arrow 3 from 1,-60 to 1,10 as 2

# Label coordinates are relative to the graph window, not to the function, centered at the 1/4 and 3/4 width points
set label 1 "Passband" at graph 0.25, graph 0.1 c
set label 2 "Stopband" at graph 0.75, graph 0.1 c

# Asymptote lines and slope lines are the same "arrow" style
set style line 3 lt 3 lw 1
set style arrow 3 nohead ls 3

# Draw asymptote lines
set arrow 1 from 1,0 to 1000,-60 as 3
set arrow 2 from .001,0 to 1,0 as 3

# -3 dB arrow style and arrow
set style line 4 lt 4 lw 1
set style arrow 4 head filled size screen 0.02,15,45 ls 4
set arrow 4 from 2,3 to 1,0 as 4

# "Cutoff frequency" label uses same coordinates as the function
set label 3 "Cutoff frequency" at 2,4 l

# "-3 dB" label
set arrow 5 from 0.5,-6 to 1,-3 as 4
set label 4 "-3.01 dB" at 0.5,-7 r

# Draw slope lines and label
set arrow 6 from 100,-20 to 12,-20 as 3
set arrow 7 from 100,-20 to 100,-39 as 3
set label 5 "Slope: -20 dB/decade" at 100,-18 c

# Plot the filter response
plot \
     dB(G(x,1)) ls 1  title "1st-order response"
|


|
File:Butterworth response.svg é uma versão vetorial deste ficheiro. Ela deve ser usada em vez desta imagem em formato raster, se não for de qualidade inferior.
File:Butterworth response.png → File:Butterworth response.svg
Para mais informações, consulte Ajuda:SVG. |
 |
Licenciamento
- Pode:
- partilhar – copiar, distribuir e transmitir a obra
- recombinar – criar obras derivadas
- De acordo com as seguintes condições:
- atribuição – Tem de fazer a devida atribuição da autoria, fornecer uma hiperligação para a licença e indicar se foram feitas alterações. Pode fazê-lo de qualquer forma razoável, mas não de forma a sugerir que o licenciador o apoia ou subscreve o seu uso da obra.
- partilha nos termos da mesma licença – Se remisturar, transformar ou ampliar o conteúdo, tem de distribuir as suas contribuições com a mesma licença ou uma licença compatível com a original.

|
É concedida permissão para copiar, distribuir e/ou modificar este documento nos termos da Licença de Documentação Livre GNU, versão 1.2 ou qualquer versão posterior publicada pela Free Software Foundation; sem Secções Invariantes, sem textos de Capa e sem textos de Contra-Capa. É incluída uma cópia da licença na secção intitulada GNU Free Documentation License. |
Histórico do ficheiro
Clique uma data e hora para ver o ficheiro tal como ele se encontrava nessa altura.
| Data e hora | Miniatura | Dimensões | Utilizador | Comentário | |
|---|---|---|---|---|---|
| atual | 17h45min de 23 de julho de 2005 | | 1 240 × 880 (86 kB) | Omegatron | split the cutoff frequency markers |
| 16h31min de 23 de julho de 2005 |  | 1 250 × 880 (92 kB) | Omegatron | Better butterworth filter response curve | |
| 19h54min de 26 de junho de 2005 |  | 250 × 220 (2 kB) | Omegatron | A graph or diagram made by User:Omegatron. (Uploaded with Wikimedia Commons.) Source: Created by User:Omegatron {{GFDL}}{{cc-by-sa-2.0}} Category:Diagrams\ |
Utilização local do ficheiro
As seguintes 3 páginas usam este ficheiro:
Utilização global do ficheiro
As seguintes wikis usam este ficheiro:
- be-tarask.wikipedia.org
- de.wikipedia.org
- eo.wikipedia.org
- et.wikipedia.org
- fr.wikipedia.org
- hi.wikipedia.org
- it.wikipedia.org
- ja.wikipedia.org
- pl.wikipedia.org
- zh.wikipedia.org