
Ficheiro:DT fusion rxnrate.svg

Dimensões desta antevisão em PNG do ficheiro SVG: 360 × 324 píxeis Outras resoluções: 267 × 240 píxeis | 533 × 480 píxeis | 853 × 768 píxeis | 1 138 × 1 024 píxeis | 2 276 × 2 048 píxeis.
Imagem numa resolução maior (ficheiro SVG, de 360 × 324 píxeis, tamanho: 12 kB)
|
|
Esta imagem provém do Wikimedia Commons, um acervo de conteúdo livre da Wikimedia Foundation que pode ser utilizado por outros projetos.
|
Descrição do ficheiro
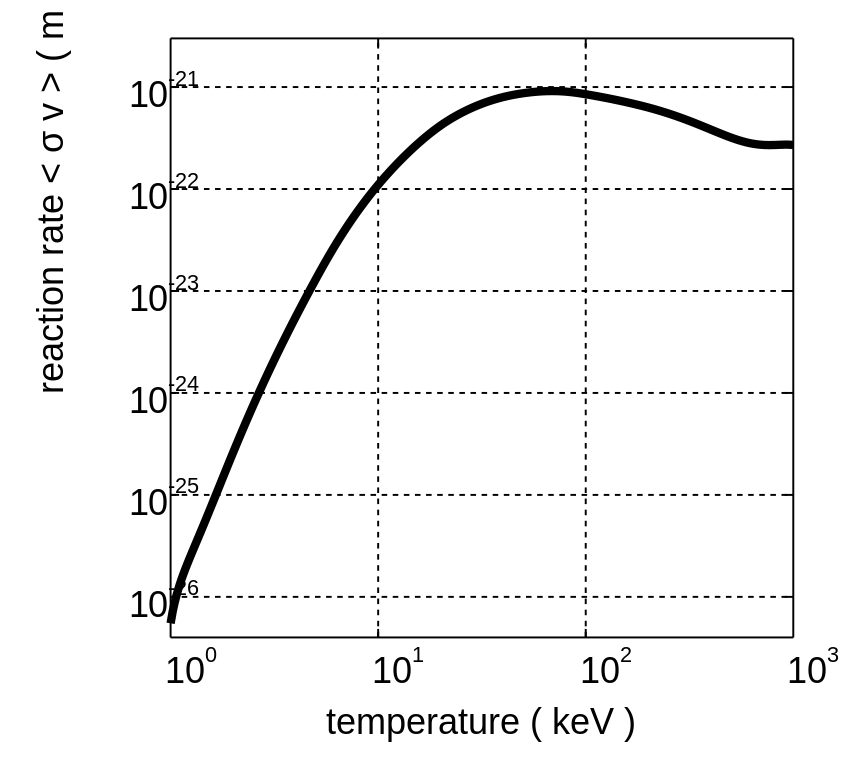
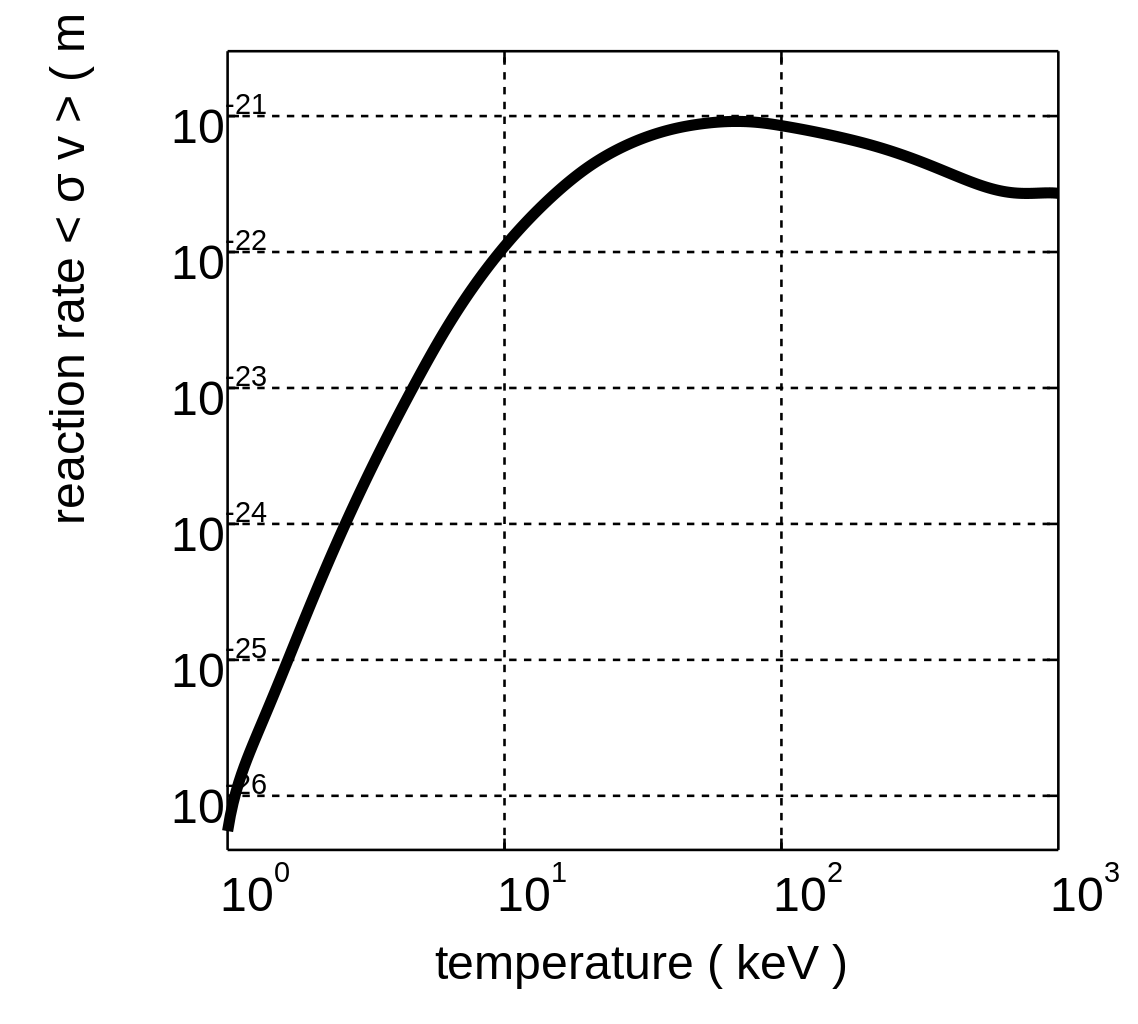
Logarithmic plot of the deuteron-triton fusion reaction rate <σv>, for Maxwellian ion velocity distributions with the same temperature. Created on 10 December 2005 by David Strozzi using Matlab. The curve is a spline interpolation through the data points included on p. 45 of the 2000 revision of the "NRL Plasma Formulary."
Licenciamento
A utilização deste ficheiro é regulada nos termos da licença Creative Commons - Atribuição-CompartilhaIgual 2.5 Genérica.
- Pode:
- partilhar – copiar, distribuir e transmitir a obra
- recombinar – criar obras derivadas
- De acordo com as seguintes condições:
- atribuição – Tem de fazer a devida atribuição da autoria, fornecer uma hiperligação para a licença e indicar se foram feitas alterações. Pode fazê-lo de qualquer forma razoável, mas não de forma a sugerir que o licenciador o apoia ou subscreve o seu uso da obra.
- partilha nos termos da mesma licença – Se remisturar, transformar ou ampliar o conteúdo, tem de distribuir as suas contribuições com a mesma licença ou uma licença compatível com a original.
Histórico do ficheiro
Clique uma data e hora para ver o ficheiro tal como ele se encontrava nessa altura.
| Data e hora | Miniatura | Dimensões | Utilizador | Comentário | |
|---|---|---|---|---|---|
| atual | 00h15min de 12 de dezembro de 2005 | | 360 × 324 (12 kB) | Dstrozzi~commonswiki | Logarithmic plot of the deuteron-triton fusion reaction rate <σv>, for Maxwellian ion velocity distributions with the same temperature. Created on 11 December 2005 by David Strozzi using Matlab. The curve is a spline interpolation through the data |
| 22h01min de 10 de dezembro de 2005 |  | 270 × 234 (12 kB) | Dstrozzi~commonswiki | Logarithmic plot of the deuteron-triton fusion reaction rate <σv>, for Maxwellian ion velocity distributions with the same temperature. Created on 10 December 2005 by David Strozzi using Matlab. The curve is a spline interpolation through the data | |
| 20h19min de 10 de dezembro de 2005 | 270 × 3 (12 kB) | Dstrozzi~commonswiki | Logarithmic plot of the deuteron-triton fusion reaction rate <σv>, for Maxwellian ion velocity distributions with the same temperature. Created on 10 December 2005 by David Strozzi using Matlab. The curve is a spline interpolation through the data | ||
| 19h52min de 10 de dezembro de 2005 | 270 × 3 (12 kB) | Dstrozzi~commonswiki | Logarithmic plot of the deuteron-triton fusion reaction rate <σv>, for Maxwellian ion velocity distributions with the same temperature. Created on 10 December 2005 by David Strozzi using Matlab. The curve is a spline interpolation through the data | ||
| 07h24min de 10 de dezembro de 2005 |  | 512 × 333 (12 kB) | Dstrozzi~commonswiki | Logarithmic plot of the deuteron-triton fusion reaction rate <v>, for Maxwellian ion velocity distributions with the same temperature. Created on 9 December 2005 by David Strozzi using Matlab. The curve is a spline interpolation through the data points i |
Utilização local do ficheiro
A seguinte página usa este ficheiro:
Utilização global do ficheiro
As seguintes wikis usam este ficheiro:
- bs.wikipedia.org
- eo.wikipedia.org
- es.wikipedia.org
- fr.wikibooks.org
- hr.wikipedia.org
- ko.wikipedia.org
- no.wikipedia.org
- sh.wikipedia.org
- sr.wikipedia.org