
Ficheiro:Polar Bear Habitat.png

Imagem numa resolução maior (981 × 879 píxeis, tamanho: 605 kB, tipo MIME: image/png)
|
|
Esta imagem provém do Wikimedia Commons, um acervo de conteúdo livre da Wikimedia Foundation que pode ser utilizado por outros projetos.
|
Descrição do ficheiro
| Descrição |
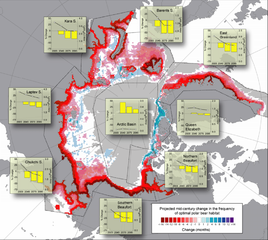
Projected changes (based on 10 IPCC AR-4 GCM models run with the SRES- A1B forcing scenario) in the spatial distribution and integrated annual area of optimal polar bear habitat. Base map shows the cumulative number of months per decade where optimal polar bear habitat was either lost (red) or gained (blue) from 2001–2010 to 2041–2050. Offshore gray shading denotes areas where optimal habitat was absent in both periods. Insets show the average annual ( 12 months) cumulative area of optimal habitat (right y-axis, line plot) for four 10-year periods in the 21st century (x-axis midpoints), and their associated percent change in area (left y axis, histograms) relative to the first decade (2001–2010). |
| Origem | Predicting The Future Distribution of Polar Bear Habitat in the Polar Basin from Resource Selection Functions Applied to 21st Century General Circulation Model Projections of Sea Ice |
| Autor | USGS |
Licenciamento
Esta obra encontra-se no domínio público nos Estados Unidos por ser uma obra do Governo Federal dos EUA nos termos do Título 17, Capítulo 1, Secção 105 do US Code. Veja Copyright.
Nota: Este estatuto apenas se aplica a obras do Governo Federal, e não a obras de nenhum estado, condado, subdivisão ou município.
|
 | |
| Este ficheiro foi considerado livre de restrições conhecidas devidas a direitos de autor, incluindo todos os direitos conexos. | ||
Histórico do ficheiro
Clique uma data e hora para ver o ficheiro tal como ele se encontrava nessa altura.
| Data e hora | Miniatura | Dimensões | Utilizador | Comentário | |
|---|---|---|---|---|---|
| atual | 16h54min de 24 de novembro de 2010 | | 981 × 879 (605 kB) | PawełS | Bigger resolution. Screenshot of PDF in bigger zoom. |
| 22h46min de 30 de novembro de 2007 |  | 610 × 546 (423 kB) | Sagredo | {{Information |Description=Projected changes (based on 10 IPCC AR-4 GCM models run with the SRES- A1B forcing scenario) in the spatial distribution and integrated annual area of optimal polar bear habitat. Base map shows the cumulative number of months |
Utilização local do ficheiro
A seguinte página usa este ficheiro:
Utilização global do ficheiro
As seguintes wikis usam este ficheiro:
- ar.wikipedia.org
- ca.wikipedia.org
- cs.wikipedia.org
- de.wikipedia.org
- en.wikipedia.org
- eo.wikipedia.org
- es.wikipedia.org
- fr.wikipedia.org
- gl.wikipedia.org
- gu.wikipedia.org
- hi.wikipedia.org
- kn.wikipedia.org
- si.wikipedia.org
- vi.wikipedia.org
- zh.wikipedia.org