
Ficheiro:Web browser usage share.svg

Dimensões desta antevisão em PNG do ficheiro SVG: 600 × 600 píxeis Outras resoluções: 240 × 240 píxeis | 480 × 480 píxeis | 768 × 768 píxeis | 1 024 × 1 024 píxeis | 2 048 × 2 048 píxeis | 630 × 630 píxeis.
Imagem numa resolução maior (ficheiro SVG, de 630 × 630 píxeis, tamanho: 47 kB)
|
|
Esta imagem provém do Wikimedia Commons, um acervo de conteúdo livre da Wikimedia Foundation que pode ser utilizado por outros projetos.
|
Descrição do ficheiro
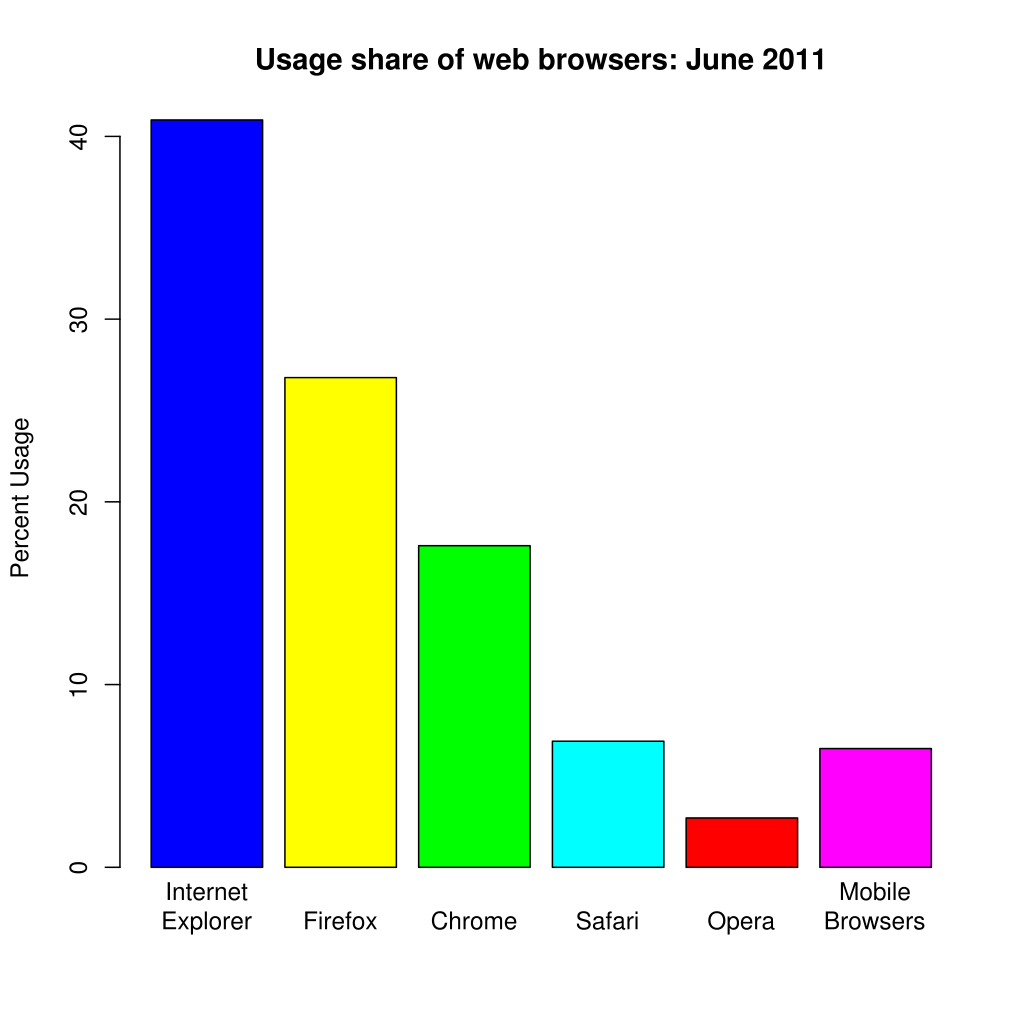
Summary: A bar chart of the usage share of web browsers using data from the median values of the summary table of en:Usage share of web browsers.
Este(a) desenho vetorial foi criado com o R.
Licenciamento
| Eu, titular dos direitos de autor desta obra, dedico-a ao domínio público, com aplicação em todo o mundo. Nalguns países isto pode não ser legalmente possível; se assim for: Concedo a todos o direito de usar esta obra para qualquer fim, sem quaisquer condições, a menos que tais condições sejam impostas por lei. |
Registo de carregamento original
A página de descrição original está aqui. Todos os nomes de utilizador a seguir referem-se a en.wikipedia.
| Upload date | User | Bytes | Dimensions | Comment |
|---|---|---|---|---|
| 2009-11-27 09:55:31 | Jdm64 | 42925 | 630×630 | Median is what we want since (1) number of sources is small (2) it's unknown how the sources calculate the percentages. Mean is just wrong. Also changed "other" to be the median of the missing from the sources. |
| 2009-11-26 21:25:07 | Thorenn | 69092 | 417×415 | Changed to match mean as opposed to median values. I used a different method to make it svg as I am unfamiliar with R. I request the original author to reflect the value changes based on my reasons stated here [[User talk:Wikiolap#Template:Browser]] marke |
| 2009-11-26 20:22:45 | Thorenn | 43926 | 630×630 | Reverted to version as of 17:45, 30 October 2009 |
| 2009-11-26 20:19:01 | Thorenn | 6843 | 555×554 | Changed to match mean as opposed to median values. Unfortunately could not make it svg. I request the original author to reflect the value changes based on my reasons stated here [[User talk:Wikiolap#Template:Browser marketshare]]. |
| 2009-11-18 18:51:40 | Jdm64 | 42912 | 630×630 | oct update |
| 2009-10-30 17:45:58 | Killiondude | 43926 | 630×630 | Reverted to version as of 12:39, 18 October 2009 |
| 2009-10-29 10:36:25 | Manfroze | 71204 | 630×630 | fixed |
| 2009-10-29 10:34:16 | Manfroze | 2615 | 630×630 | better graphics |
| 2009-10-18 12:39:54 | Gnassar | 43926 | 630×630 | Reverted to version as of 00:53, 4 October 2009 - wrong image format |
| 2009-10-18 12:38:41 | Gnassar | 9674 | 650×649 | September, with numbers from corrected article |
| 2009-10-04 00:53:05 | Clorox | 43926 | 630×630 | Reverted to version as of 03:37, 3 October 2009 (Text boxes appeared as black rectangles, oops) |
| 2009-10-04 00:52:27 | Clorox | 48079 | 630×630 | Easier to view |
| 2009-10-03 03:37:52 | Jdm64 | 43926 | 630×630 | September Update |
| 2009-09-08 02:46:33 | Jdm64 | 42182 | 630×630 | August update; use median of sources |
| 2009-08-01 19:06:43 | Jdm64 | 42385 | 630×630 | July update |
| 2009-06-03 21:28:33 | Jdm64 | 41510 | 630×630 | May update |
| 2009-05-03 19:53:42 | Jdm64 | 42231 | 630×630 | April update |
| 2009-04-02 16:15:44 | Jdm64 | 41969 | 630×630 | March Update |
| 2009-03-03 05:45:18 | Jdm64 | 42514 | 630×630 | February update |
| 2009-02-01 23:09:25 | Jdm64 | 43133 | 630×630 | '''Summary''': A pie chart of the usage share of web browsers using data from [http://marketshare.hitslink.com/browser-market-share.aspx?qprid=0 Net Applications]. It was created using [[R (programming language)|R]] with the following R code: <pre> browse |
derivative works
Obras derivadas deste ficheiro: Web browser usage share fr.svg
Histórico do ficheiro
Clique uma data e hora para ver o ficheiro tal como ele se encontrava nessa altura.
| Data e hora | Miniatura | Dimensões | Utilizador | Comentário | |
|---|---|---|---|---|---|
| atual | 23h55min de 16 de julho de 2011 | | 630 × 630 (47 kB) | Daniel.Cardenas | Updated with June 2011 data |
| 04h36min de 8 de junho de 2011 |  | 630 × 630 (44 kB) | Jdm64 | may update | |
| 20h39min de 23 de abril de 2011 |  | 630 × 630 (46 kB) | Daniel.Cardenas | Updated with March data | |
| 00h11min de 14 de fevereiro de 2011 |  | 630 × 630 (10 kB) | Beao | Real text and transparent. | |
| 20h20min de 5 de fevereiro de 2011 |  | 630 × 630 (45 kB) | Daniel.Cardenas | update for 2011-01 | |
| 02h43min de 9 de janeiro de 2011 |  | 630 × 630 (47 kB) | Daniel.Cardenas | Update for 2010-12 | |
| 18h11min de 15 de dezembro de 2010 |  | 630 × 630 (46 kB) | Daniel.Cardenas | Updated medians | |
| 14h53min de 8 de dezembro de 2010 |  | 630 × 630 (66 kB) | Daniel.Cardenas | Revision 1 for november. | |
| 01h36min de 27 de novembro de 2010 |  | 630 × 630 (45 kB) | Jdm64 | minor tweaks | |
| 20h33min de 26 de novembro de 2010 |  | 630 × 630 (67 kB) | Daniel.Cardenas | Added mobile browser. Created with following R commands: title = "Usage share of web browsers: October 2010" percent = c(47.34, 29.67, 11.90, 5.50, 1.92, 3.81) name = c("Internet\nExplorer", "Firefox", "Chrome", "Safari", "Opera", "Mobile\nBrowser") colo |
Utilização local do ficheiro
Não há nenhuma página que use este ficheiro.
Utilização global do ficheiro
As seguintes wikis usam este ficheiro:
- ca.wikipedia.org
- ml.wikipedia.org
- zh.wikipedia.org