
Ficheiro:2009-2010 South Pacific cyclone season summary.png
Dimensões desta antevisão: 800 × 500 píxeis. Outras resoluções: 320 × 200 píxeis | 640 × 400 píxeis | 1 024 × 640 píxeis | 1 280 × 800 píxeis | 2 560 × 1 600 píxeis | 4 000 × 2 500 píxeis.
Imagem numa resolução maior (4 000 × 2 500 píxeis, tamanho: 608 kB, tipo MIME: image/png)
|
|
Esta imagem provém do Wikimedia Commons, um acervo de conteúdo livre da Wikimedia Foundation que pode ser utilizado por outros projetos.
|
| Descrição |
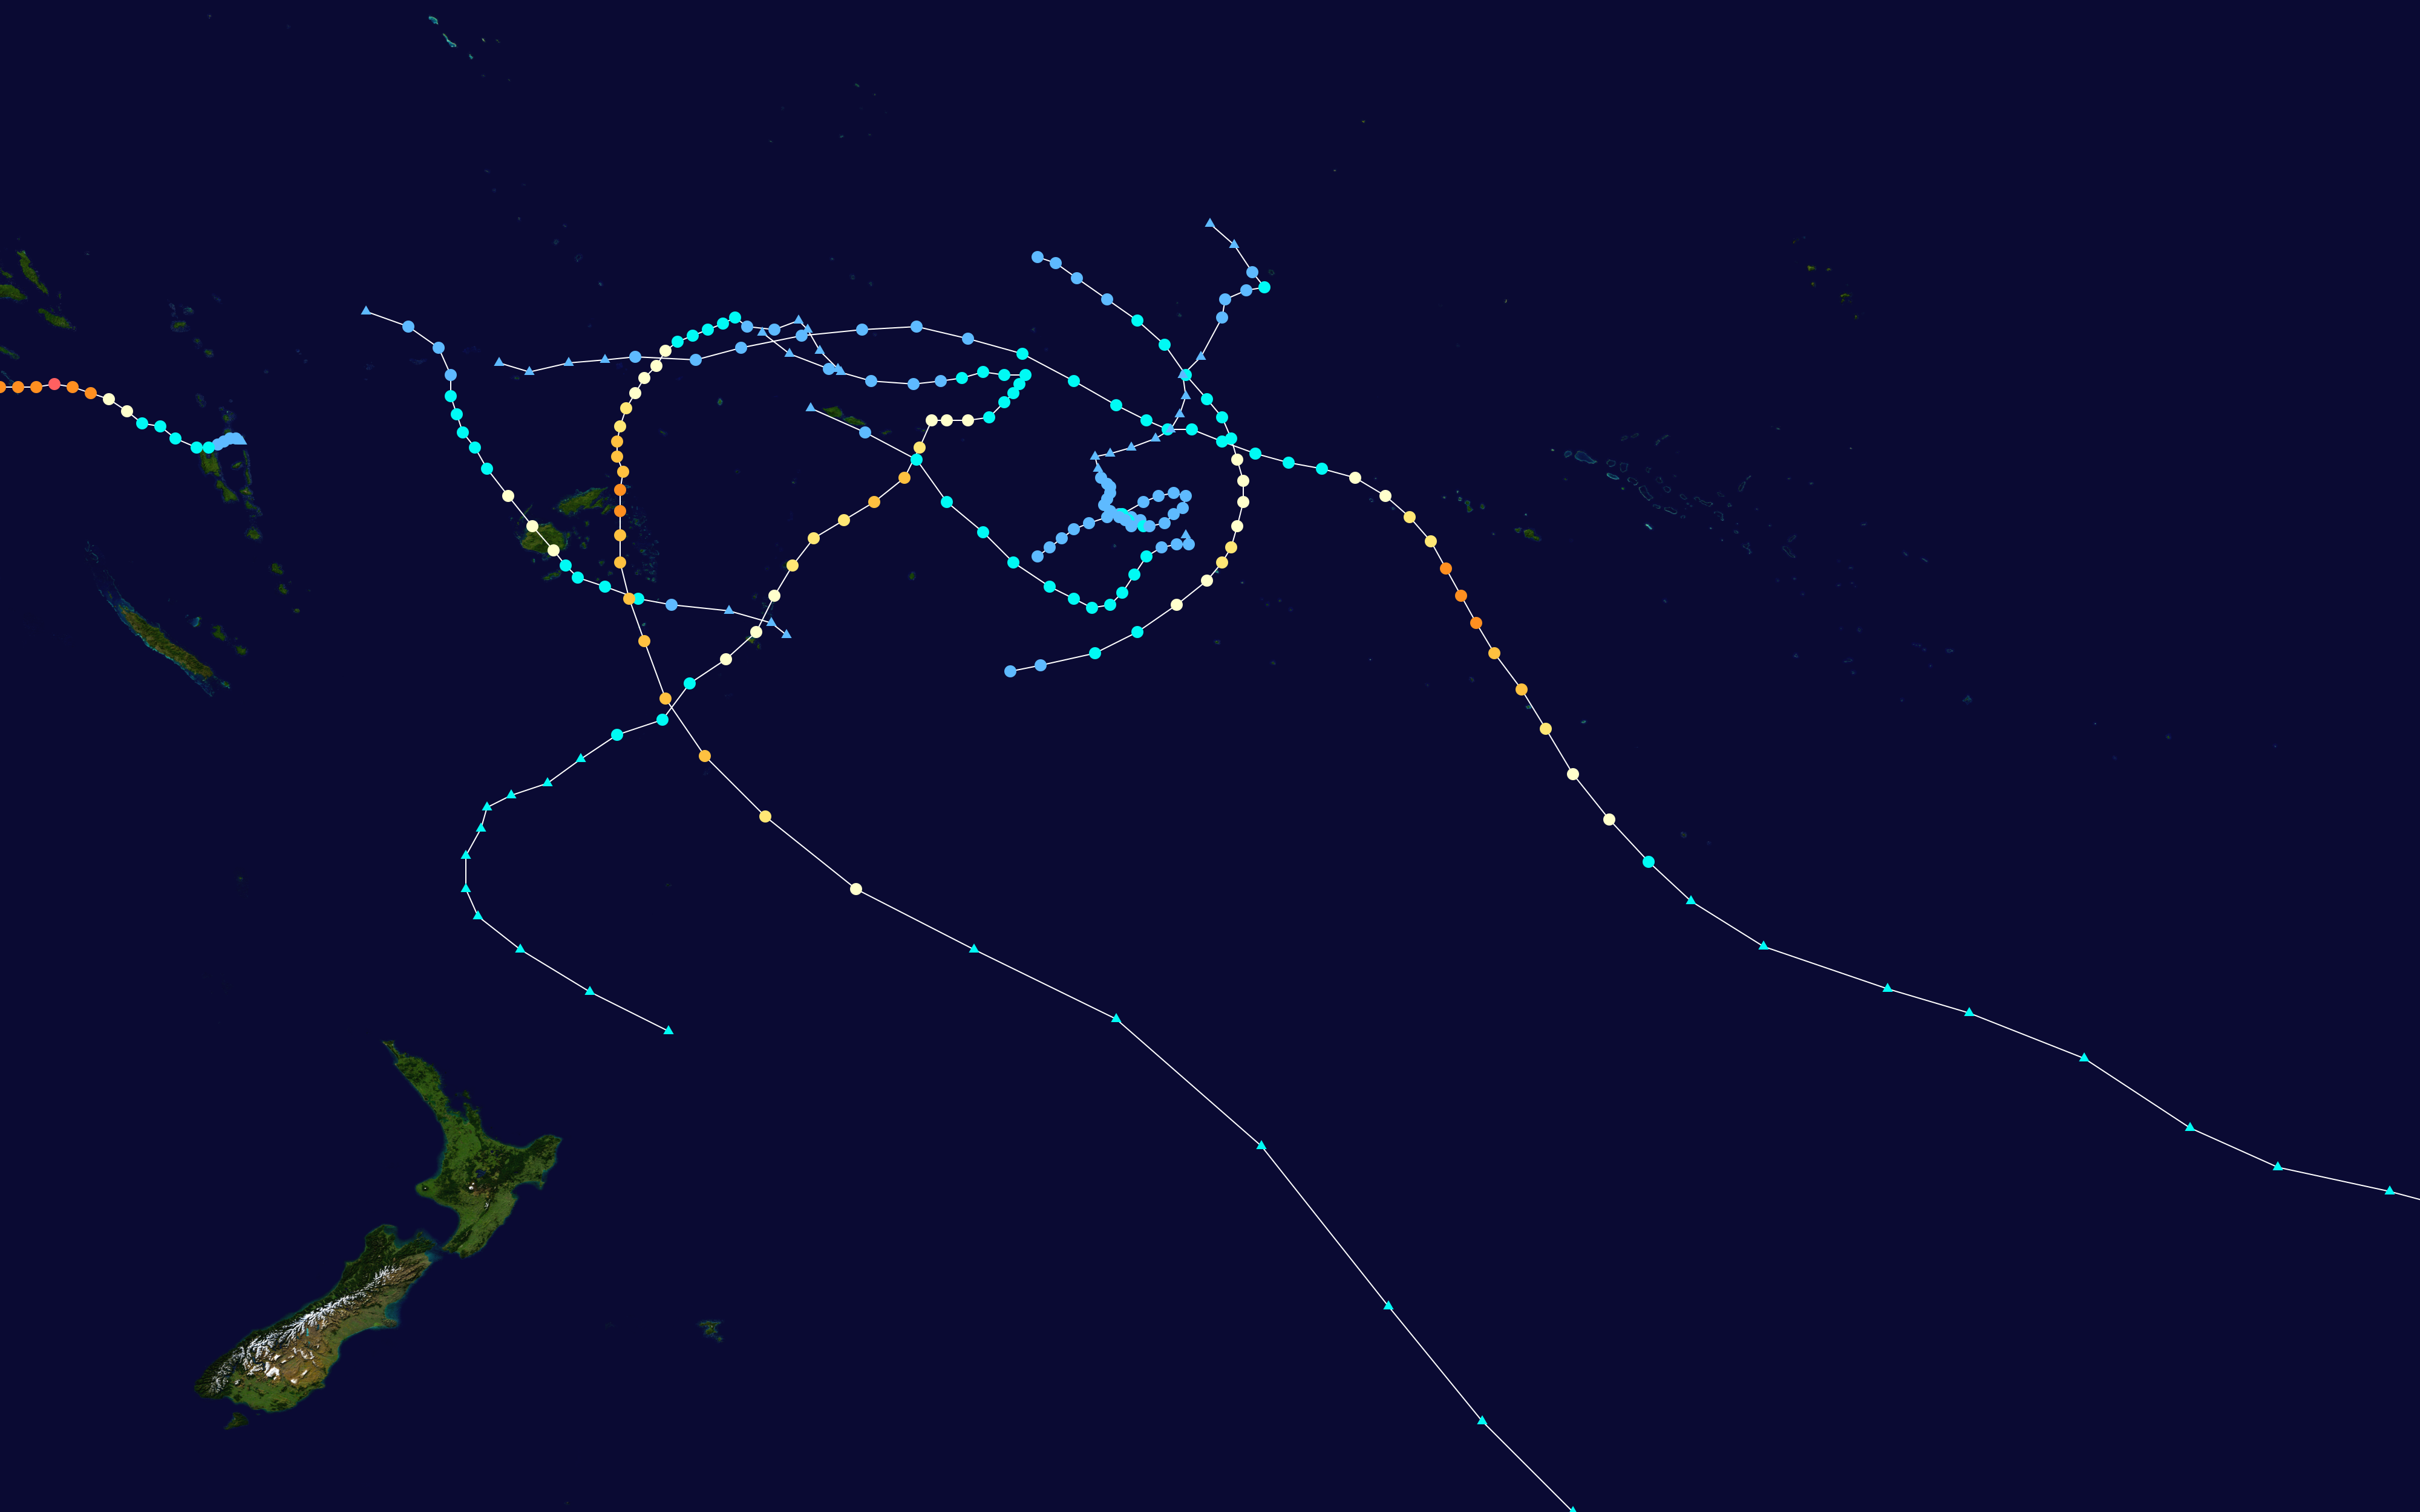
English: This map shows the tracks of all tropical cyclones in the 2009-10 South Pacific cyclone season. The points show the location of each storm at 6-hour intervals. The colour represents the storm's maximum sustained wind speeds as classified in the Saffir-Simpson Hurricane Scale (see below), and the shape of the data points represent the type of the storm.
Tropical depression (≤38 mph, ≤62 km/h)
Tropical storm (39–73 mph, 63–118 km/h)
Category 1 (74–95 mph, 119–153 km/h)
Category 2 (96–110 mph, 154–177 km/h)
Category 3 (111–129 mph, 178–208 km/h)
Category 4 (130–156 mph, 209–251 km/h)
Category 5 (≥157 mph, ≥252 km/h)
Unknown
Storm type |
| Origem | Created using Wikipedia:WikiProject Tropical cyclones/Tracks. The background image is from NASA [1]. The tracking data is from the Joint Typhoon Warning Center's best track database |
| Autor | Keith Edkins |
| Esta obra foi dedicada ao domínio público pelo autor, Keith Edkins, com aplicação em todo o mundo. Nalguns países isto pode não ser legalmente possível; se assim for: Keith Edkins concede a todos o direito de usar esta obra para qualquer fim, sem quaisquer condições, a menos que tais condições sejam impostas por lei. |
Histórico do ficheiro
Clique uma data e hora para ver o ficheiro tal como ele se encontrava nessa altura.
| Data e hora | Miniatura | Dimensões | Utilizador | Comentário | |
|---|---|---|---|---|---|
| atual | 06h00min de 28 de junho de 2020 | | 4 000 × 2 500 (608 kB) | Supportstorm | Best track update (removed minor systems without best track data) |
| 12h56min de 21 de março de 2010 |  | 1 024 × 633 (115 kB) | Keith Edkins | Update with Tomas and SPAC section of Ului | |
| 18h37min de 3 de março de 2010 |  | 1 024 × 633 (108 kB) | Keith Edkins | Update with Sarah | |
| 16h06min de 18 de fevereiro de 2010 |  | 1 024 × 633 (103 kB) | Keith Edkins | Update with Rene | |
| 13h03min de 13 de fevereiro de 2010 |  | 1 024 × 633 (96 kB) | Keith Edkins | Update with Pat | |
| 20h31min de 7 de fevereiro de 2010 |  | 1 024 × 633 (91 kB) | Keith Edkins | Update with Oli & 08F | |
| 13h35min de 31 de janeiro de 2010 |  | 1 024 × 633 (75 kB) | Keith Edkins | Update with 05F and Nisha | |
| 21h21min de 21 de janeiro de 2010 |  | 1 024 × 633 (69 kB) | Keith Edkins | Sorry, wrong file | |
| 21h20min de 21 de janeiro de 2010 |  | 1 024 × 633 (285 kB) | Keith Edkins | Update with South Pacific portion of Tropical Depression 04F | |
| 12h46min de 13 de janeiro de 2010 |  | 1 024 × 633 (66 kB) | Keith Edkins | {{Information |Description={{en|Track map of all storms in the 2009–10 South Pacific cyclone season. The points show the location of each storm at 6-hour intervals. The colour represents the storm's [[:w:maxi |
Utilização local do ficheiro
As seguintes 3 páginas usam este ficheiro:
Utilização global do ficheiro
As seguintes wikis usam este ficheiro:
- en.wikipedia.org
- ko.wikipedia.org
- zh.wikipedia.org