Ficheiro:Milankovitch Variations.png

O conteúdo da página não é suportado noutras línguas.
Origem: Wikipédia, a enciclopédia livre.

Milankovitch_Variations.png(479 × 363 píxeis, tamanho: 32 kB, tipo MIME: image/png)

Descrição do ficheiro

Descrição
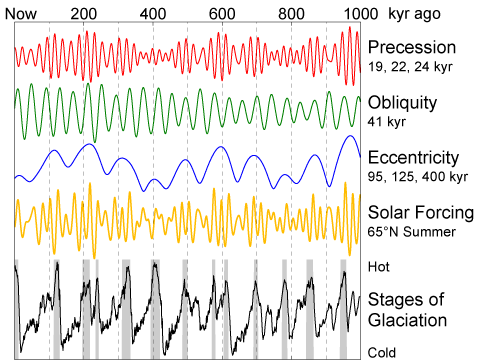
English: This figure shows the variations in Earth's orbit, the resulting changes in solar energy flux at high latitude, and the observed glacial cycles.

According to Milankovitch Theory, the precession of the equinoxes and the apsides, variations in the tilt of the Earth's axis (obliquity) and changes in the eccentricity of the Earth's orbit are responsible for causing the observed 100 kyr cycle in ice ages by varying the amount of sunlight received by the Earth at different times and locations, particularly high northern latitude summer. These changes in the Earth's orbit are the predictable consequence of interactions between the Earth, its moon, and the other planets.

The orbital data shown are from Quinn et al. (1991). Principal frequencies for each of the three kinds of variations are labeled. The solar forcing curve (aka "insolation") is derived from July 1st sunlight at 65 °N latitude according to Jonathan Levine's insolation calculator [1]. The glacial data are from Lisiecki and Raymo (2005) and gray bars indicate interglacial periods, defined here as deviations in the 5 kyr average of at least 0.8 standard deviations above the mean.
Data 11 de fevereiro de 2006 (data do carregamento)
Origem Obra do próprio
Autor This image was produced by Robert A. Rohde from publicly available data, and is incorporated into the Global Warming Art project.
Outras versões Obras derivadas deste ficheiro:  Variacions de Milankovitch.png

References

  • Lisiecki, L. E., and M. E. Raymo (2005), "A Pliocene-Pleistocene stack of 57 globally distributed benthic δ18O records." Paleoceanography 20, PA1003, doi:10.1029/2004PA001071 (alternative full text link: [2]).
  • Quinn, T. R., S. Tremaine, and M. Duncan (1991), "A Three Million Year Integration of the Earth's Orbit." The Astronomical Journal 101, pp. 2287-2305, doi:10.1086/115850.


Esta imagem de gráficos (ou todas as imagens neste artigo ou categoria) deveriam ser recriadas usando gráficos vectoriais, como ficheiros SVG. Isto tem várias vantagens; veja as Commons:Media for cleanup|imagens para rever para mais informações. Se já criou um ficheiro SVG desta imagem, por favor, carregue-o. Depois do novo ficheiro SVG ter sido carregado, substitua aqui esta predefinição pela predefinição {{vector version available|nome da nova imagem.svg}}.

Licenciamento

Image from Global Warming Art
This image is an original work created for Global Warming Art. Please refer to the image description page for more information.
GNU head É concedida permissão para copiar, distribuir e/ou modificar este documento nos termos da Licença de Documentação Livre GNU, versão 1.2 ou qualquer versão posterior publicada pela Free Software Foundation; sem Secções Invariantes, sem textos de Capa e sem textos de Contra-Capa. É incluída uma cópia da licença na secção intitulada GNU Free Documentation License.
w:pt:Creative Commons
atribuição partilha nos termos da mesma licença
A utilização deste ficheiro é regulada nos termos da licença Creative Commons - Atribuição-CompartilhaIgual 3.0 Não Adaptada.
Pode:
  • partilhar – copiar, distribuir e transmitir a obra
  • recombinar – criar obras derivadas
De acordo com as seguintes condições:
  • atribuição – Tem de fazer a devida atribuição da autoria, fornecer uma hiperligação para a licença e indicar se foram feitas alterações. Pode fazê-lo de qualquer forma razoável, mas não de forma a sugerir que o licenciador o apoia ou subscreve o seu uso da obra.
  • partilha nos termos da mesma licença – Se remisturar, transformar ou ampliar o conteúdo, tem de distribuir as suas contribuições com a mesma licença ou uma licença compatível com a original.
Esta marca de licenciamento foi adicionada a este ficheiro durante a atualização da licença GFDL.

Legendas

Adicione uma explicação de uma linha do que este ficheiro representa

Elementos retratados neste ficheiro

retrata

Histórico do ficheiro

Clique uma data e hora para ver o ficheiro tal como ele se encontrava nessa altura.

Data e horaMiniaturaDimensõesUtilizadorComentário
atual11h35min de 11 de fevereiro de 2006Miniatura da versão das 11h35min de 11 de fevereiro de 2006479 × 363 (32 kB)David Legrand== Description == This figure shows the variations in Earth's orbit, the resulting changes in solar energy flux at high latitude, and the observed glacial cycles. According to Milankovitch Theory, the precession of the [[

A seguinte página usa este ficheiro:

Utilização global do ficheiro

As seguintes wikis usam este ficheiro:

Ver mais utilizações globais deste ficheiro.