Ficheiro:XYCoordinates.gif
XYCoordinates.gif (454 × 189 píxeis, tamanho: 1,53 MB, tipo MIME: image/gif, cíclico, 49 quadros, 6,7 s)
|
|
Esta imagem provém do Wikimedia Commons, um acervo de conteúdo livre da Wikimedia Foundation que pode ser utilizado por outros projetos.
|
Índice
Descrição do ficheiro
| DescriçãoXYCoordinates.gif |
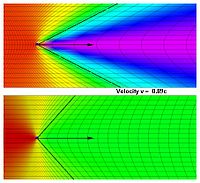
English: Demonstration of Aberration of light and Relativistic Doppler effect. In this diagram, the blue point represents the observer. The x,y-plane is represented by yellow graph paper. As the observer accelerates, he sees the graph paper change colors. Also he sees the distortion of the x,y-grid due to the aberration of light. The black vertical line is the y-axis. The observer accelerates along the x-axis.
|
| Origem |
|
| Autor | TxAlien em Wikipédia em inglês |
How these images were made

Animation: Image:Lcprojection2m.gif
In this section we will use the Minkowski space 4-dimension vectors and units where speed of light c = 1. In this notation velocity vector is
where
is a 3D velocity vector and
The component 

In spacetime, any small object is the sequence of spacetime events or world lines. Hence a 3D object in space-time can be described as a set of world lines corresponding to all the points that make up that object. Consider a simple objects in the space such as a sphere:

where a and b are parameters of the mapping and r is the radius of the sphere. To make the formulas easy to read we will leave out the parameters (a,b). In the frame where the object is at rest, the set of world lines can be represented as the world surface in Minkowski space
or
where 

it can be written as
At any given observer time
the surface in 3-d space after substitution
and
can be written as
However, observer can only see the object on light cone in the past when light is emitted by points on the object. Therefore, if observers coordinates are (t,0,0,0) he sees (Diagram 1) the surface points where they were in time
or in our notation
Solution to this equation is
Hence the observer will see the surface
where
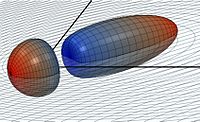
On Diagram 2 surface 

It's still not finished--TxAlien 05:04, 3 September 2006 (UTC)
Other images
 Animation: Media:Waves01.gif |
 Animation: Media:Compare03s.gif |
Next pictures show a model of movement through a subway tunnel at an increasing speed. Observer would not only see changes in colors but the outer walls will also appear convex. This convex appearance is due to seeing parts of the tunnel at different moments in time because of the finite speed of light. This effect is called aberration of light.
 Animation: Media:RelSubway2.gif |
 Animation: Media:RelSubway2.gif |
 |
This images shows the view on a sphere moving at 0.7c relatively to a stationary observer, which is represented by blue point. Curved lines represent the xy grid coordinates of a moving system.
 Animation: Media:SphereAberration01.gif |
 Animation: Media:SphereAberration01.gif |
 Animation: Media:SphereAberration01.gif |
 Animation: Image:Tachyon03.gif |
 |
All these images are graphical solutions of an accurate mathematical model which is based on the Lorentz transformation
Licenciamento
| A utilização deste ficheiro é regulada nos termos da licença Creative Commons - Atribuição-CompartilhaIgual 3.0 Não Adaptada. Sujeito a aviso legal (disclaimer). | ||
| Atribuição: TxAlien em Wikipédia inglesa | ||
| ||
| Esta marca de licenciamento foi adicionada a este ficheiro durante a atualização da licença GFDL.http://creativecommons.org/licenses/by-sa/3.0/CC BY-SA 3.0Creative Commons Attribution-Share Alike 3.0truetrue |

|
É concedida permissão para copiar, distribuir e/ou modificar este documento nos termos da Licença de Documentação Livre GNU, versão 1.2 ou qualquer versão posterior publicada pela Free Software Foundation; sem Secções Invariantes, sem textos de Capa e sem textos de Contra-Capa. É incluída uma cópia da licença na secção intitulada GNU Free Documentation License. Sujeito a aviso legal (disclaimer).http://www.gnu.org/copyleft/fdl.htmlGFDLGNU Free Documentation Licensetruetrue |
Registo de carregamento original
- 2006-08-12 23:50 TxAlien 454×189× (1600354 bytes) Demonstration of light aberration and [[Relativistic Doppler effect]].
Legendas
Elementos retratados neste ficheiro
retrata
Histórico do ficheiro
Clique uma data e hora para ver o ficheiro tal como ele se encontrava nessa altura.
| Data e hora | Miniatura | Dimensões | Utilizador | Comentário | |
|---|---|---|---|---|---|
| atual | 21h28min de 15 de janeiro de 2012 |  | 454 × 189 (1,53 MB) | Cantons-de-l'Est | {{Information |Description={{en|Demonstration of en:Aberration of light and en:Relativistic Doppler effect. In this diagram, the blue point represents the observer. The x,y-plane is represented by yellow graph paper. As the observer accelerate |
Utilização local do ficheiro
As seguintes 2 páginas usam este ficheiro:
Utilização global do ficheiro
As seguintes wikis usam este ficheiro:
- bs.wikipedia.org
- es.wikipedia.org
- fr.wikipedia.org
- tr.wikipedia.org


