Ficheiro:MultivariateNormal.png

O conteúdo da página não é suportado noutras línguas.
Origem: Wikipédia, a enciclopédia livre.

Imagem numa resolução maior(842 × 637 píxeis, tamanho: 159 kB, tipo MIME: image/png)

File:Multivariate normal sample.svg é uma versão vetorial deste ficheiro. Ela deve ser usada em vez desta imagem em formato raster, se não for de qualidade inferior.

File:MultivariateNormal.png → File:Multivariate normal sample.svg

Para mais informações, consulte Ajuda:SVG.

Em outras línguas
Alemannisch  Bahasa Indonesia  Bahasa Melayu  British English  català  čeština  dansk  Deutsch  eesti  English  español  Esperanto  euskara  français  Frysk  galego  hrvatski  Ido  italiano  lietuvių  magyar  Nederlands  norsk bokmål  norsk nynorsk  occitan  Plattdüütsch  polski  português  português do Brasil  română  Scots  sicilianu  slovenčina  slovenščina  suomi  svenska  Tiếng Việt  Türkçe  vèneto  Ελληνικά  беларуская (тарашкевіца)  български  македонски  нохчийн  русский  српски / srpski  татарча/tatarça  українська  ქართული  հայերեն  বাংলা  தமிழ்  മലയാളം  ไทย  한국어  日本語  简体中文  繁體中文  עברית  العربية  فارسی  +/−
Nova imagem SVG

Descrição do ficheiro

Descrição
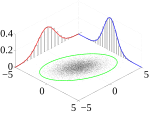
English: Illustration of a multivariate gaussian distribution and its marginals. Matlab code provided below.
Data
Origem Obra do próprio
Autor Bscan
%This script illustrates a multivariate Gaussian distribution and its
%marginal distributions

%This code is issued under the CC0 "license"

%Define limits of plotting
X = -5:0.1:5;
Y = -5:0.1:5;

%2-d Mean and covariance matrix
MeanVec = [0 0];
CovMatrix = [1 0.6; 0.6 2];

%Get the 1-d PDFs for the "walls"
Z_x = normpdf(X,MeanVec(1), sqrt(CovMatrix(1,1)));
Z_y = normpdf(Y,MeanVec(2), sqrt(CovMatrix(2,2)));

%Get the 2-d samples for the "floor"
Samples = mvnrnd(MeanVec, CovMatrix, 10000);

%Get the sigma ellipses by transform a circle by the cholesky decomp
L = chol(CovMatrix,'lower');
t = linspace(0,2*pi,100); %Our ellipse will have 100 points on it
C = [cos(t) ; sin(t)]; %A unit circle
E1 = 1*L*C; E2 = 2*L*C; E3 = 3*L*C; %Get the 1,2, and 3-sigma ellipses

figure; hold on; 
%Plot the samples on the "floor"
plot3(Samples(:,1),Samples(:,2),zeros(size(Samples,1),1),'k.','MarkerSize',2)
%Plot the 1,2, and 3-sigma ellipses slightly above the floor
%plot3(E1(1,:), E1(2,:), 1e-3+zeros(1,size(E1,2)),'Color','g','LineWidth',2);
%plot3(E2(1,:), E2(2,:), 1e-3+zeros(1,size(E2,2)),'Color','g','LineWidth',2);
plot3(E3(1,:), E3(2,:), 1e-3+zeros(1,size(E3,2)),'Color','g','LineWidth',2);

%Plot the histograms on the walls from the data in the middle
[n_x, xout] = hist(Samples(:,1),20);%Creates 20 bars
n_x = n_x ./ ( sum(n_x) *(xout(2)-xout(1)));%Normalizes to be a pdf
[~,~,~,x_Pos,x_Height] = makebars(xout,n_x);%Creates the bar points
plot3(x_Pos, Y(end)*ones(size(x_Pos)),x_Height,'-k')

%Now plot the other histograms on the wall
[n_y, yout] = hist(Samples(:,2),20);
n_y = n_y ./ ( sum(n_y) *(yout(2)-yout(1)));
[~,~,~,y_Pos,y_Height] = makebars(yout,n_y);
plot3(X(1)*ones(size(y_Pos)),y_Pos, y_Height,'-k')

%Now plot the 1-d pdfs over the histograms
plot3(X, ones(size(X))*Y(end), Z_x,'-b','LineWidth',2); 
plot3(ones(size(Y))*X(1), Y, Z_y,'-r','LineWidth',2);

%Make the figure look nice
grid on; view(45,55);
axis([X(1) X(end) Y(1) Y(end)])

Licenciamento

Eu, titular dos direitos de autor desta obra, publico-a com a seguinte licença:
Creative Commons CC-Zero A utilização deste ficheiro é regulada nos termos Creative Commons - CC0 1.0 Dedicação Universal ao Domínio Público.
A pessoa que associou uma obra a este documento dedicou-a ao domínio público, renunciando a todos os seus direitos sobre a obra em todo o mundo ao abrigo da legislação de direitos de autor, incluindo a todos os direitos legais conexos, na medida permitida por lei. Pode copiar, modificar, distribuir e executar a obra, até com fins comerciais, sem pedir autorização.

Legendas

Adicione uma explicação de uma linha do que este ficheiro representa

Elementos retratados neste ficheiro

retrata

Histórico do ficheiro

Clique uma data e hora para ver o ficheiro tal como ele se encontrava nessa altura.

Data e horaMiniaturaDimensõesUtilizadorComentário
atual19h30min de 22 de março de 2013Miniatura da versão das 19h30min de 22 de março de 2013842 × 637 (159 kB)BscanUser created page with UploadWizard

A seguinte página usa este ficheiro:

Utilização global do ficheiro

Metadados