
Ficheiro:Subprime crisis - Foreclosures & Bank Instability.png

Imagem numa resolução maior (960 × 720 píxeis, tamanho: 16 kB, tipo MIME: image/png)
|
|
Esta imagem provém do Wikimedia Commons, um acervo de conteúdo livre da Wikimedia Foundation que pode ser utilizado por outros projetos.
|

|
Esta imagem de um diagrama (ou todas as imagens neste artigo ou categoria) deveriam ser recriadas usando gráficos vectoriais, como ficheiros SVG. Isto tem várias vantagens; veja as Commons:Media for cleanup|imagens para rever para mais informações. Se já criou um ficheiro SVG desta imagem, por favor, carregue-o. Depois do novo ficheiro SVG ter sido carregado, substitua aqui esta predefinição pela predefinição {{vector version available|nome da nova imagem.svg}}.
|
| Descrição |
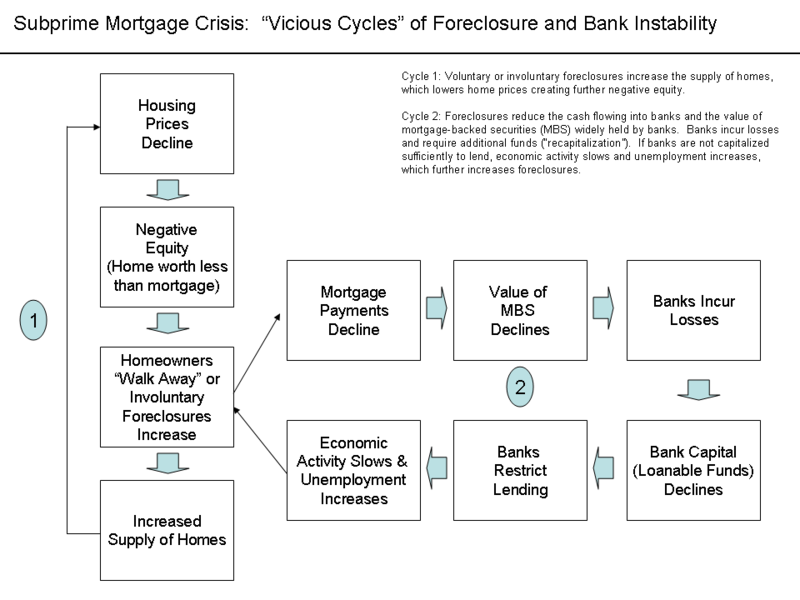
English: Chart showing feedback loops within housing market and with financial market and economy Descrição do ficheiroThis diagram explains two vicious cycles at the heart of the subprime mortgage crisis. Cycle One: Housing MarketThe first cycle is within the housing market. Voluntary or involuntary foreclosures increase the supply of homes, which lowers home prices creating further negative equity. By September 2008, average U.S. housing prices had declined by over 20% from their mid-2006 peak.[1][2] This major and unexpected decline in house prices means that many borrowers have zero or negative equity in their homes, meaning their homes were worth less than their mortgages. As of March 2008, an estimated 8.8 million borrowers — 10.8% of all homeowners — had negative equity in their homes, a number that is believed to have risen to 12 million by November 2008. Borrowers in this situation have an incentive to "walk away" from their mortgages and abandon their homes, even though doing so will damage their credit rating for a number of years. The reason is that unlike what is the case in most other countries, American residential mortgages are non-recourse loans; once the creditor has regained the property purchased with a mortgage in default, he has no further claim against the defaulting borrower's income or assets. As more borrowers stop paying their mortgage payments, foreclosures and the supply of homes for sale increase. This places downward pressure on housing prices, which further lowers homeowners' equity. The decline in mortgage payments also reduces the value of mortgage-backed securities, which erodes the net worth and financial health of banks. This vicious cycle is at the heart of the crisis.[3] Cycle Two: Financial Market and Feedback into Housing MarketForeclosures reduce the cash flowing into banks and the value of mortgage-backed securities (MBS) widely held by banks. Banks incur losses and require additional funds (“recapitalization”). If banks are not capitalized sufficiently to lend, economic activity slows and unemployment increases, which further increases foreclosures. As of August 2008, financial firms around the globe have written down their holdings of subprime related securities by US$501 billion. Mortgage defaults and provisions for future defaults caused profits at the 8533 USA depository institutions insured by the FDIC to decline from $35.2 billion in 2006 Q4 billion to $646 million in the same quarter a year later, a decline of 98%. 2007 Q4 saw the worst bank and thrift quarterly performance since 1990. In all of 2007, insured depository institutions earned approximately $100 billion, down 31% from a record profit of $145 billion in 2006. Profits declined from $35.6 billion in 2007 Q1 to $19.3 billion in 2008 Q1, a decline of 46%. Federal Reserve data indicates banks have significantly tightened lending standards throughout the crisis.[4] Unemployment in the U.S. has increased to a 14-year high as of November 2008.[5] Further Sources and SolutionsEconomist Nouriel Roubini described the vicious cycles within and across the housing market and financial markets during interviews with Charlie Rose in September and October 2008.[6] He further describes the crisis in these other video segments.[7][8] He called for an additional $250 billion to help recapitalize the banks, closure of insolvent "zombie" banks, regulatory overhaul, and $300 billion in infrastructure spending during these interviews. ReferencesSee alsoThe images below contain additional high-level explanation of the crisis further citations. thumb|Factors Contributing to Housing Bubble – Diagram 1 of 2 thumb|Domino Effect As Housing Prices Declined – Diagram 2 of 2 |
| Data | |
| Origem | Obra do próprio (Texto original: “I created this work entirely by myself.”) |
| Autor | Farcaster (talk) 17:06, 26 December 2008 (UTC) |
- ↑ Case Shiller Index
- ↑ Economist-A Helping Hand to Homeowners
- ↑ NYT - How to Help People Who's Homes are Underwater
- ↑ Banks Tighten Lending Standards
- ↑ https://www.nytimes.com/2008/11/08/business/economy/08econ.html?pagewanted=print NY Times - Unemployment]
- ↑ Charlie Rose - Roubini & Panel
- ↑ Rose & Roubini Discussion
- ↑ Rose & Roubini
Licenciamento
- Pode:
- partilhar – copiar, distribuir e transmitir a obra
- recombinar – criar obras derivadas
- De acordo com as seguintes condições:
- atribuição – Tem de fazer a devida atribuição da autoria, fornecer uma hiperligação para a licença e indicar se foram feitas alterações. Pode fazê-lo de qualquer forma razoável, mas não de forma a sugerir que o licenciador o apoia ou subscreve o seu uso da obra.
- partilha nos termos da mesma licença – Se remisturar, transformar ou ampliar o conteúdo, tem de distribuir as suas contribuições com a mesma licença ou uma licença compatível com a original.

|
É concedida permissão para copiar, distribuir e/ou modificar este documento nos termos da Licença de Documentação Livre GNU, versão 1.2 ou qualquer versão posterior publicada pela Free Software Foundation; sem Secções Invariantes, sem textos de Capa e sem textos de Contra-Capa. É incluída uma cópia da licença na secção intitulada GNU Free Documentation License. |
Registo de carregamento original
- 2008-12-26 17:34 Farcaster 960×720× (16380 bytes)
- 2008-12-26 17:29 Farcaster 960×720× (16314 bytes)
- 2008-12-26 17:06 Farcaster 960×720× (16314 bytes) {{Information |Description=Chart showing feedback loops within housing market and with financial market and economy |Source=I created this work entirely by myself. |Date= |Author=~~~~ |other_versions= }}
Histórico do ficheiro
Clique uma data e hora para ver o ficheiro tal como ele se encontrava nessa altura.
| Data e hora | Miniatura | Dimensões | Utilizador | Comentário | |
|---|---|---|---|---|---|
| atual | 00h51min de 14 de outubro de 2010 | | 960 × 720 (16 kB) | Hideokun | {{Information |Description={{en|Chart showing feedback loops within housing market and with financial market and economy<br/> ==Description== This diagram explains two vicious cycles at the heart of the [[:en:subprime mortgage crisis |
Utilização local do ficheiro
A seguinte página usa este ficheiro:
Utilização global do ficheiro
As seguintes wikis usam este ficheiro:
- en.wikipedia.org
- fa.wikipedia.org
- hi.wikipedia.org
- ja.wikipedia.org
- ta.wikipedia.org