
Ficheiro:1982- Deaths from mass shootings in the U.S - scatterplot and line chart.svg

Dimensões desta antevisão em PNG do ficheiro SVG: 800 × 600 píxeis Outras resoluções: 320 × 240 píxeis | 640 × 480 píxeis | 1 024 × 768 píxeis | 1 280 × 960 píxeis | 2 560 × 1 920 píxeis | 1 000 × 750 píxeis.
Imagem numa resolução maior (ficheiro SVG, de 1 000 × 750 píxeis, tamanho: 4 kB)
|
|
Esta imagem provém do Wikimedia Commons, um acervo de conteúdo livre da Wikimedia Foundation que pode ser utilizado por outros projetos.
|
Descrição do ficheiro
| Descrição |
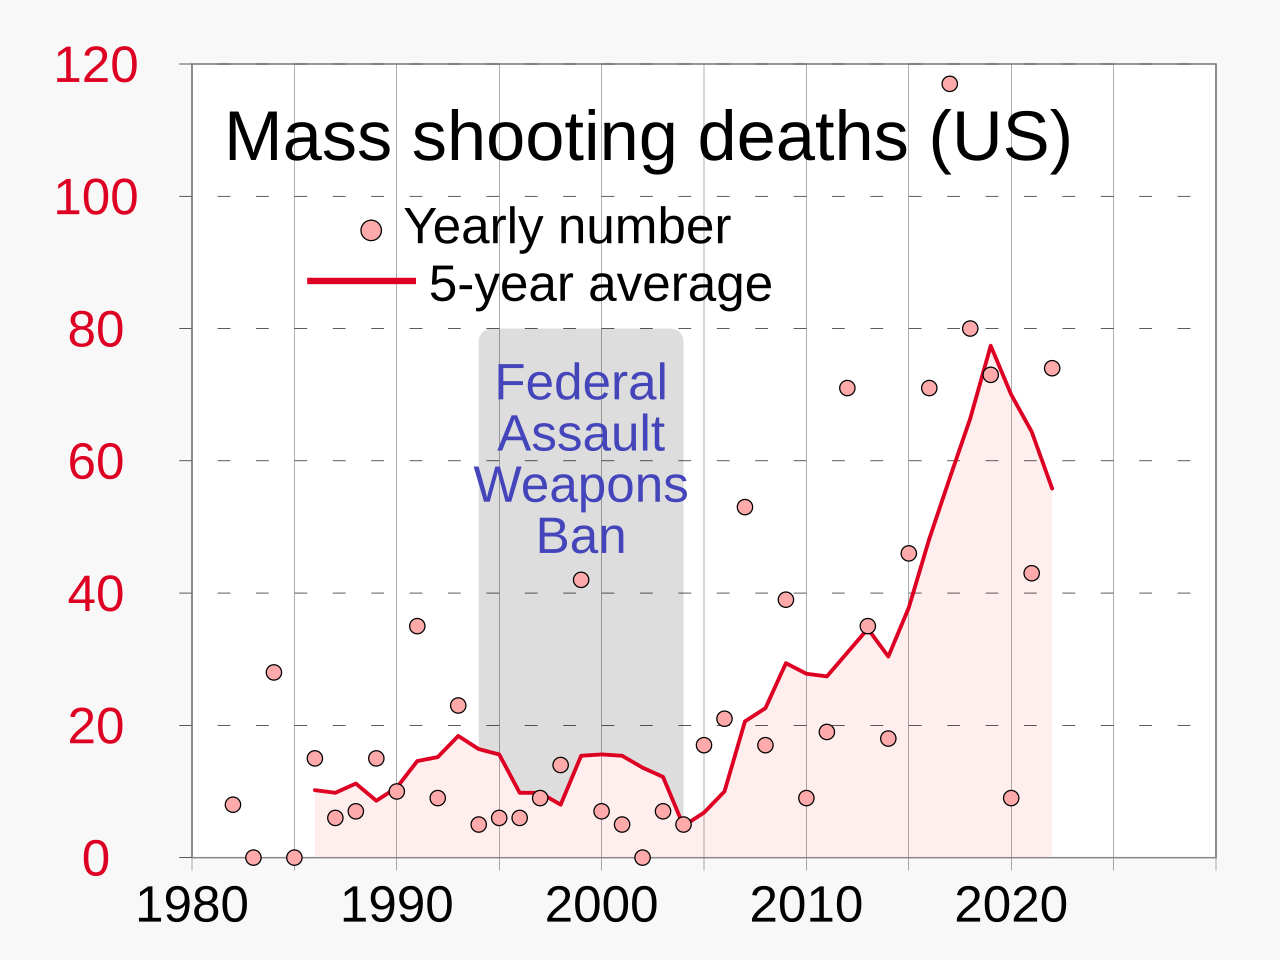
English: Chart showing deaths from mass shootings in the U.S., including 5-year moving average, beginning in 1982
|
||
| Data | |||
| Origem | Obra do próprio | ||
| Autor | RCraig09 |

Related files
-
 Predecessor PNG file
 -
 Predecessor JPG file


Licenciamento
Eu, titular dos direitos de autor desta obra, publico-a com a seguinte licença:
A utilização deste ficheiro é regulada nos termos da licença Creative Commons Atribuição-CompartilhaIgual 4.0 Internacional.
- Pode:
- partilhar – copiar, distribuir e transmitir a obra
- recombinar – criar obras derivadas
- De acordo com as seguintes condições:
- atribuição – Tem de fazer a devida atribuição da autoria, fornecer uma hiperligação para a licença e indicar se foram feitas alterações. Pode fazê-lo de qualquer forma razoável, mas não de forma a sugerir que o licenciador o apoia ou subscreve o seu uso da obra.
- partilha nos termos da mesma licença – Se remisturar, transformar ou ampliar o conteúdo, tem de distribuir as suas contribuições com a mesma licença ou uma licença compatível com a original.
Histórico do ficheiro
Clique uma data e hora para ver o ficheiro tal como ele se encontrava nessa altura.
| Data e hora | Miniatura | Dimensões | Utilizador | Comentário | |
|---|---|---|---|---|---|
| atual | 04h47min de 4 de abril de 2023 | | 1 000 × 750 (4 kB) | RCraig09 | Version 3: add to legend |
| 03h46min de 2 de abril de 2023 |  | 1 000 × 750 (4 kB) | RCraig09 | Version 2: reduce thickness of line trace to be less dominant (compatible with related charts) | |
| 21h43min de 31 de março de 2023 |  | 1 000 × 750 (4 kB) | RCraig09 | Uploaded own work with UploadWizard |
Utilização local do ficheiro
A seguinte página usa este ficheiro:
Utilização global do ficheiro
As seguintes wikis usam este ficheiro:
- cy.wikipedia.org
- en.wikipedia.org
- en.wikiquote.org
- es.wikipedia.org
- fr.wikipedia.org
- he.wikipedia.org
- id.wikipedia.org
- it.wikipedia.org
- ja.wikipedia.org
- pl.wikipedia.org
- ru.wikipedia.org
- vi.wikipedia.org
- zh.wikipedia.org