
Ficheiro:BernoullisLawDerivationDiagram.png
BernoullisLawDerivationDiagram.png (790 × 370 píxeis, tamanho: 9 kB, tipo MIME: image/png)
|
|
Esta imagem provém do Wikimedia Commons, um acervo de conteúdo livre da Wikimedia Foundation que pode ser utilizado por outros projetos.
|

|
File:BernoullisLawDerivationDiagram.svg é uma versão vetorial deste ficheiro. Ela deve ser usada em vez desta imagem em formato raster, se não for de qualidade inferior.
File:BernoullisLawDerivationDiagram.png → File:BernoullisLawDerivationDiagram.svg
Para mais informações, consulte Ajuda:SVG. |
 |
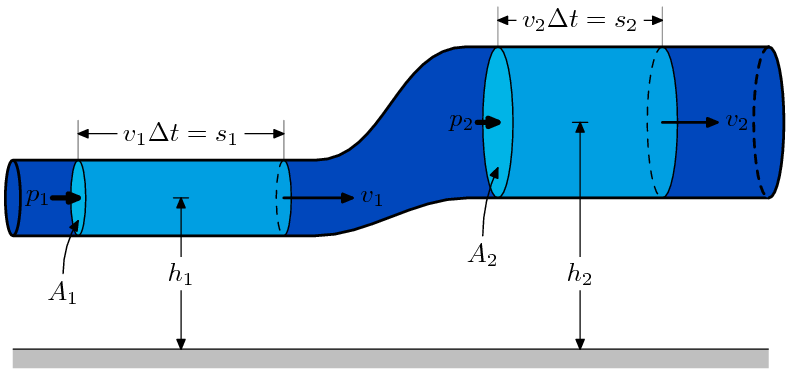
This is a diagram for one derivation of Bernoulli's Equation. I created this image using MetaPost; in order to produce the raster form, I compiled the source with MetaPost, embedded the resulting file in a pdfLaTeX document, viewed the PDF file with GSview (I tried Acrobat Reader, but its antialiasing was rather poor), and took a screen capture.
The MetaPost source code for this image is provided below (it is licensed under the same licenses as the image) in order to allow easy modification of the image. It's not particularly well-written code (one of my goals in creating it was to learn MetaPost), but anyone who might find it useful can try to make some use of it.
%%%%%%%%%%%%%%%%%%%%%%%%%%%%%%%%%%%%%%%%%%%%%%%%%%%%%%%%%%%%%%%%%%%%%%%%%%%%%%
%  bernoulli.mp                                                              %
%  A MetaPost diagram                                                        %
%  Created on 12 July 2005                                                   %
%  Copyright (c) 2005 by MannyMax                                            %
%  Some rights reserved; see accompanying information for details            %
%%%%%%%%%%%%%%%%%%%%%%%%%%%%%%%%%%%%%%%%%%%%%%%%%%%%%%%%%%%%%%%%%%%%%%%%%%%%%%

beginfig(1);

u := 1cm;
path t,b,m,pa[],pb[];
pair a[],b[];
picture alab[],blab[];
numeric lwidth,lheight,rwidth,rheight,tubelen,cpgap;
color backcol,chunkcol,capcol;

lwidth = 1u;
rwidth = 2u;
lheight= 2u;
rheight= 3u;
tubelen= 10u;
cpgap  = 1u;

%set diagram colors
backcol = 0.27734375*green + 0.73828125*blue;
chunkcol= 0.62500000*green + 0.88281250*blue;
capcol  = 0.70703125*green + 0.90234375*blue;

z0=(                0, lheight+(lwidth/2));
z4=((tubelen/2)-cpgap, lheight+(lwidth/2));
z5=((tubelen/2)+cpgap, rheight+(rwidth/2));
z1=(          tubelen, rheight+(rwidth/2));

z2=(                0, lheight-(lwidth/2));
z6=((tubelen/2)-cpgap, lheight-(lwidth/2));
z7=((tubelen/2)+cpgap, rheight-(rwidth/2));
z3=(          tubelen, rheight-(rwidth/2));

t=z0---z4..z5---z1;
b=z2---z6..z7---z3;
m=1/2[z0,z2]..1/2[z4,z6]..1/2[z5,z7]..1/2[z1,z3];

fill buildcycle(z0--z2,t,z1--z3,b) withcolor backcol;

fill unitsquare xscaled tubelen yscaled 0.25u shifted (0,-0.25u) withcolor 0.75*white;
linecap := butt;
draw (0,0)--(tubelen,0);
linecap := rounded;

%DRAW CHUNK A

a0=point(0.3) of t;
a1=point(0.8) of t;
a2=point(0.3) of b;
a3=point(0.8) of b;
pa1=buildcycle(a0--a2,t,a1--a3,b);

pa2 = fullcircle rotated 180 xscaled (0.2*lwidth) yscaled lwidth shifted 1/2[a0,a2];
pa3 = halfcircle rotated -90 xscaled (0.2*lwidth) yscaled lwidth shifted 1/2[a1,a3];
pa4 = halfcircle rotated  90 xscaled (0.2*lwidth) yscaled lwidth shifted 1/2[a1,a3];

pa5 = buildcycle(pa2,t,pa3,b);

fill pa2 withcolor capcol;
fill pa5 withcolor chunkcol;
draw pa2;
draw pa3;
draw pa4 dashed evenly;

a9 = center(buildcycle(pa4,pa3));
pa6 = a9--(a9+(a9-center(pa2))/3);
draw      pa6 cutafter  pa3 withpen pencircle scaled 1;
drawarrow pa6 cutbefore pa3 withpen pencircle scaled 1;
label.rt (btex $v_1$ etex, point(1) of pa6);

pa7 = (a2-(0.2u,0.5u)){dir(90)}..2/5[a2,center(pa2)];
drawarrow pa7;
label.bot(btex $A_1$ etex, point(0) of pa7);

a4 = whatever[a0,a3]=whatever[a1,a2];
a5 = (xpart(a4),0);
a6 = a5+(0,1u);
drawdblarrow a5--a4;
draw (a4-(0.1u,0))--(a4+(0.1u,0));
alab1 = thelabel(btex $h_1$ etex, (0,0));
unfill bbox alab1 shifted a6;
draw        alab1 shifted a6;

a11 = center(pa2);
a10 = a11+(a11-a9)/8;
drawarrow a10--a11 withpen pencircle scaled 2;
label.lft(btex $p_1$ etex, 1/4[a10,a11]);

a7 = a0 + (0,0.35u);
a8 = a1 + (0,0.35u);
draw a0--(a7 + (0,0.175u)) withcolor 0.5*white;
draw a1--(a8 + (0,0.175u)) withcolor 0.5*white;
drawdblarrow a7--a8;
alab2 =thelabel(btex $v_1\Delta t=s_1$ etex, (0,0));
unfill bbox alab2 shifted 1/2[a7,a8];
draw alab2 shifted 1/2[a7,a8];

%DRAW CHUNK B

b0=point(2.2) of t;
b1=point(2.6) of t;
b2=point(2.2) of b;
b3=point(2.6) of b;
pb1=buildcycle(b0--b2,t,b1--b3,b);
fill pb1 withcolor 0.6[blue,white];

pb2 = fullcircle rotated 180 xscaled (0.2*rwidth) yscaled rwidth shifted 1/2[b0,b2];
pb3 = halfcircle rotated -90 xscaled (0.2*rwidth) yscaled rwidth shifted 1/2[b1,b3];
pb4 = halfcircle rotated  90 xscaled (0.2*rwidth) yscaled rwidth shifted 1/2[b1,b3];

pb5 = buildcycle(pb2,t,pb3,b);

fill pb2 withcolor capcol;
fill pb5 withcolor chunkcol;
draw pb2;
draw pb3;
draw pb4 dashed evenly;

b9 = center(buildcycle(pb4,pb3));
pb6 = b9--(b9+(b9-center(pb2))/3);
draw      pb6 cutafter  pb3 withpen pencircle scaled 1;
drawarrow pb6 cutbefore pb3 withpen pencircle scaled 1;
label.rt (btex $v_2$ etex, point(1) of pb6);

pb7 = (b2-(0.2u,0.5u)){dir(90)}..2/5[b2,center(pb2)];
drawarrow pb7;
label.bot(btex $A_2$ etex, point(0) of pb7);

b4 = whatever[b0,b3]=whatever[b1,b2];
b5 = (xpart(b4),0);
b6 = b5+(0,1u);
drawdblarrow b5--b4;
draw (b4-(0.1u,0))--(b4+(0.1u,0));
blab1 = thelabel(btex $h_2$ etex, (0,0));
unfill bbox blab1 shifted b6;
draw        blab1 shifted b6;

b11 = center(pb2);
b10 = b11+(b11-b9)/8;
drawarrow b10--b11 withpen pencircle scaled 2;
label.lft(btex $p_2$ etex, 1/4[b10,b11]);

b7 = b0 + (0,0.35u);
b8 = b1 + (0,0.35u);
draw b0--(b7 + (0,0.175u)) withcolor 0.6*white;
draw b1--(b8 + (0,0.175u)) withcolor 0.6*white;
drawdblarrow b7--b8;
blab2 =thelabel(btex $v_2\Delta t=s_2$ etex, (0,0));
unfill bbox blab2 shifted 1/2[b7,b8];
draw blab2 shifted 1/2[b7,b8];

%DRAW FLUID TUBE

linecap := butt;

draw t withpen pencircle scaled 1;
draw b withpen pencircle scaled 1;

path acap,bcap,bcapa,bcapb;
acap  = fullcircle rotated 180 xscaled (0.2*lwidth) yscaled lwidth shifted 1/2[z0,z2];
bcapa = halfcircle rotated -90 xscaled (0.2*rwidth) yscaled rwidth shifted 1/2[z1,z3];
bcapb = halfcircle rotated  90 xscaled (0.2*rwidth) yscaled rwidth shifted 1/2[z1,z3];

bcap = buildcycle(bcapa,bcapb);

fill acap withcolor backcol;
fill bcap withcolor backcol;

linecap := rounded;

draw acap  withpen pencircle scaled 1;
draw bcapa withpen pencircle scaled 1;
draw bcapb withpen pencircle scaled 1 dashed evenly;

%uncomment the following line to draw a density symbol in the center of the figure
%label (btex $\rho$ etex, 1/2[point 1.5 of t, point 1.5 of b]);

endfig;

|
É concedida permissão para copiar, distribuir e/ou modificar este documento nos termos da Licença de Documentação Livre GNU, versão 1.2 ou qualquer versão posterior publicada pela Free Software Foundation; sem Secções Invariantes, sem textos de Capa e sem textos de Contra-Capa. É incluída uma cópia da licença na secção intitulada GNU Free Documentation License. |
| A utilização deste ficheiro é regulada nos termos da licença Creative Commons - Atribuição-CompartilhaIgual 3.0 Não Adaptada. | ||
| ||
| Esta marca de licenciamento foi adicionada a este ficheiro durante a atualização da licença GFDL. |
- Pode:
- partilhar – copiar, distribuir e transmitir a obra
- recombinar – criar obras derivadas
- De acordo com as seguintes condições:
- atribuição – Tem de fazer a devida atribuição da autoria, fornecer uma hiperligação para a licença e indicar se foram feitas alterações. Pode fazê-lo de qualquer forma razoável, mas não de forma a sugerir que o licenciador o apoia ou subscreve o seu uso da obra.
- partilha nos termos da mesma licença – Se remisturar, transformar ou ampliar o conteúdo, tem de distribuir as suas contribuições com a mesma licença ou uma licença compatível com a original.
Histórico do ficheiro
Clique uma data e hora para ver o ficheiro tal como ele se encontrava nessa altura.
| Data e hora | Miniatura | Dimensões | Utilizador | Comentário | |
|---|---|---|---|---|---|
| atual | 03h37min de 13 de julho de 2005 | | 790 × 370 (9 kB) | MannyMax~commonswiki | {{GFDL}} {{cc-by-sa-2.5}} |
Utilização local do ficheiro
As seguintes 3 páginas usam este ficheiro:
Utilização global do ficheiro
As seguintes wikis usam este ficheiro:
- anp.wikipedia.org
- ar.wikipedia.org
- az.wikipedia.org
- bs.wikipedia.org
- Isaac Newton
- Blaise Pascal
- Robert Hooke
- Augustin Louis Cauchy
- Potisak
- Leonhard Euler
- Robert Boyle
- Mehanika fluida
- Hookeov zakon
- Joseph Louis Gay-Lussac
- Šablon:Mehanika kontinuuma
- Mehanika čvrstih tijela
- Viskoznost
- Statika fluida
- Mehanički napon
- Bernoullijeva jednačina
- Dinamika fluida
- Fluid
- Daniel Bernoulli
- Zakon održanja mase
- Deformacija (mehanika)
- Navier–Stokesove jednačine
- Claude-Louis Navier
- George Gabriel Stokes
- Hagen–Poiseuilleova jednačina
- Njutnovski fluid
- Savijanje
- Elastičnost (fizika)
- Čvrsto stanje
- Mehanika kontinuuma
- ca.wikipedia.org
- cs.wikipedia.org
- da.wikipedia.org
- de.wikipedia.org
- en.wikipedia.org
- en.wikiversity.org
Ver mais utilizações globais deste ficheiro.