
Ficheiro:South Africa 2001 dominant language map.svg

Dimensões desta antevisão em PNG do ficheiro SVG: 689 × 600 píxeis Outras resoluções: 276 × 240 píxeis | 552 × 480 píxeis | 882 × 768 píxeis | 1 177 × 1 024 píxeis | 2 353 × 2 048 píxeis | 1 072 × 933 píxeis.
Imagem numa resolução maior (ficheiro SVG, de 1 072 × 933 píxeis, tamanho: 1 024 kB)
|
|
Esta imagem provém do Wikimedia Commons, um acervo de conteúdo livre da Wikimedia Foundation que pode ser utilizado por outros projetos.
|
Descrição do ficheiro
| Descrição |
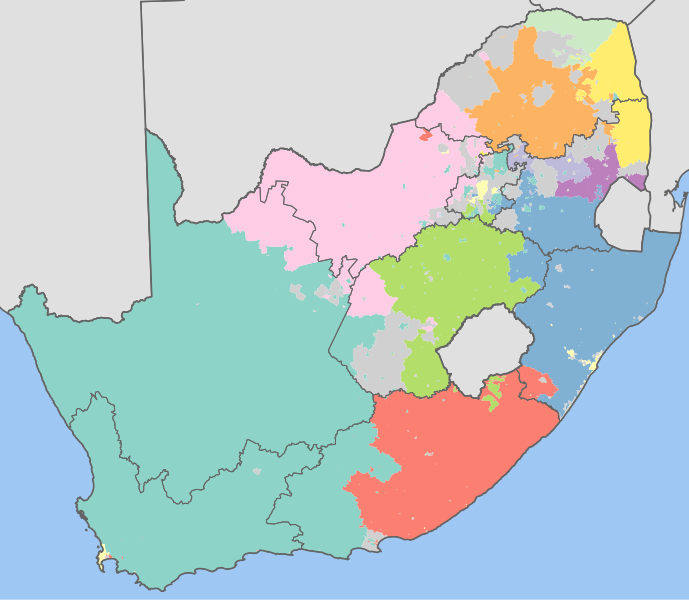
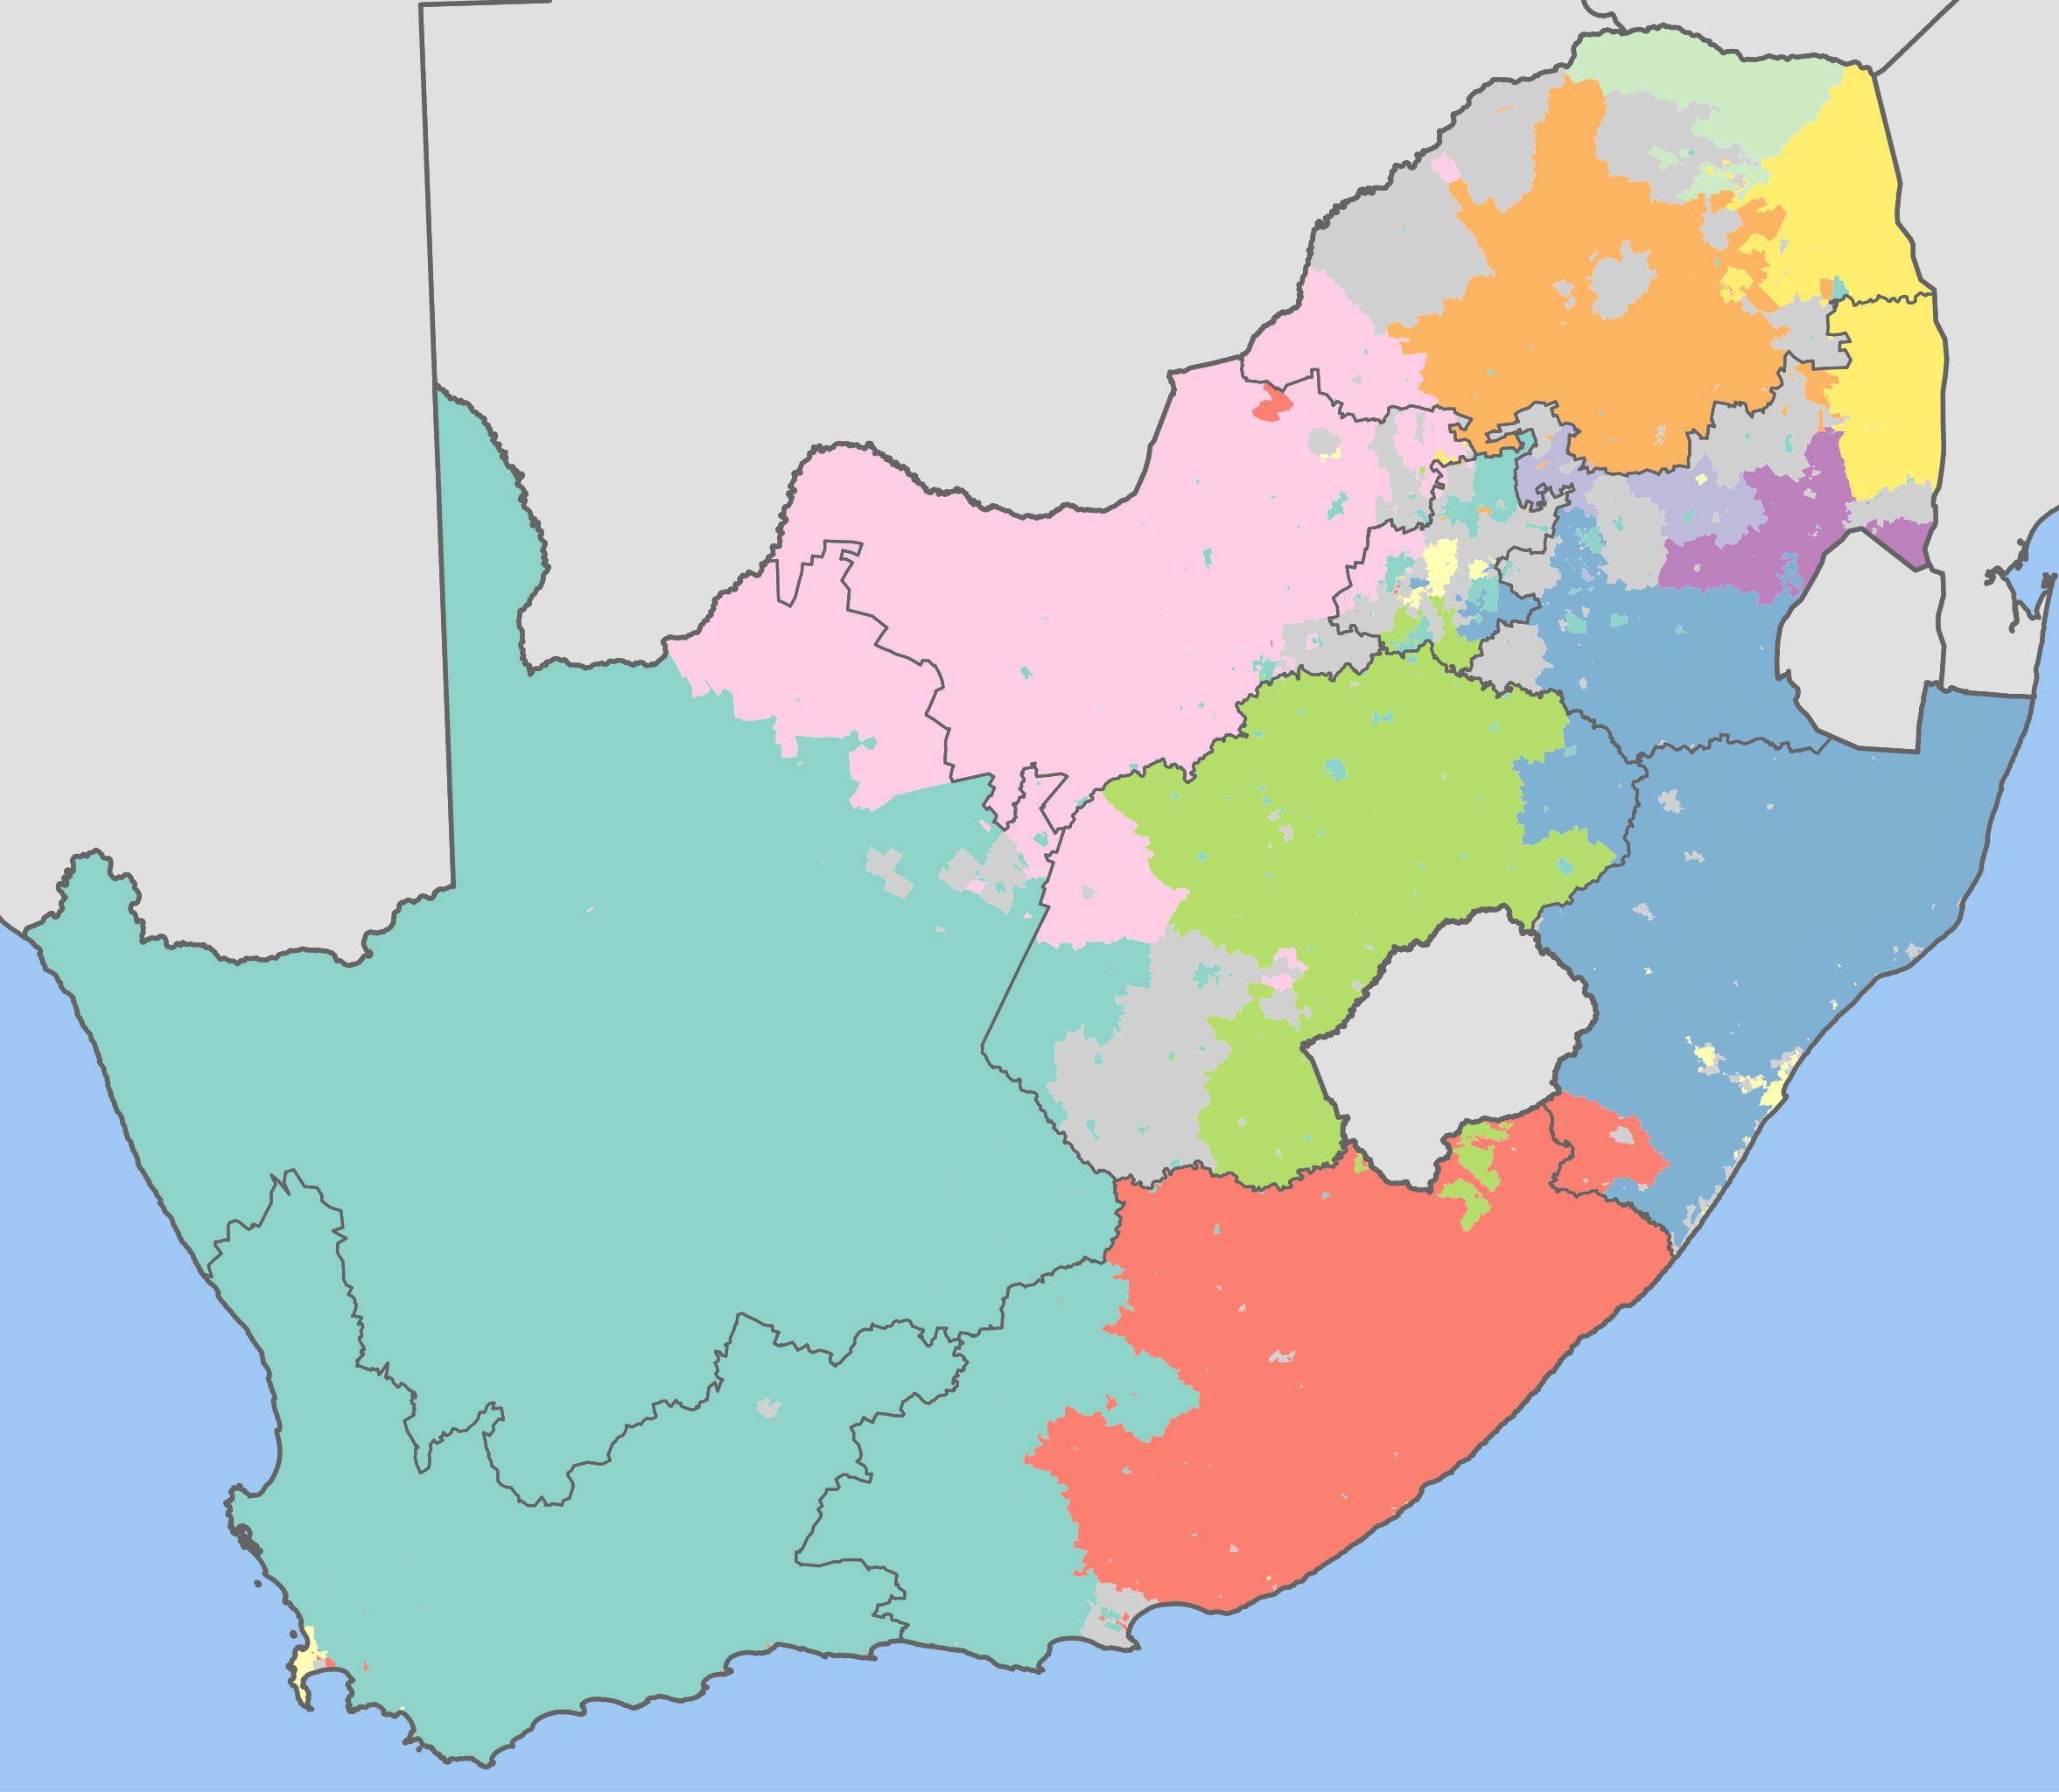
English: Map showing the dominant home languages in South Africa, according to Census 2001 at the "Main Place" level. In this context, a language is dominant if it more than 50% of the population in an area speak it at home, or more than 33% speak it and no other language is spoken by more than 25%.
Afrikaans
English
isiNdebele
isiXhosa
isiZulu
Sesotho sa Leboa
Sesotho
Setswana
siSwati
Tshivenda
Xitsonga
No language dominant
Projection is Albers Equal-Area Conic, with standard parallels at 25.5° S and 31.5° S, and origin at 28.5° S 25.5° E. |
| Data | |
| Origem | Statistics South Africa's Census 2001 is the source of the basic population data. The map results from my own processing of the data. |
| Autor | Htonl |
Licenciamento
The following license applies to the population data on which the map is based:

|
O titular dos direitos de autor deste ficheiro, Stats SA, autoriza o seu uso por qualquer pessoa para qualquer finalidade, com a condição de que a sua autoria seja devidamente atribuída. A redistribuição, obras derivadas, uso comercial e todos os demais usos são permitidos. |
Atribuição:
"the user acknowledges Stats SA as the source of the basic data wherever they process, apply, utilise, publish or distribute the data, and also that they specify that the relevant application and analysis (where applicable) result from their own processing of the data" [1]
|
The following tag applies to the map itself:
| Eu, titular dos direitos de autor desta obra, dedico-a ao domínio público, com aplicação em todo o mundo. Nalguns países isto pode não ser legalmente possível; se assim for: Concedo a todos o direito de usar esta obra para qualquer fim, sem quaisquer condições, a menos que tais condições sejam impostas por lei. |
Histórico do ficheiro
Clique uma data e hora para ver o ficheiro tal como ele se encontrava nessa altura.
| Data e hora | Miniatura | Dimensões | Utilizador | Comentário | |
|---|---|---|---|---|---|
| atual | 11h42min de 29 de novembro de 2010 | | 1 072 × 933 (1 024 kB) | Htonl | tweak |
| 14h18min de 2 de outubro de 2010 |  | 1 072 × 933 (1,02 MB) | Htonl | new approach, smaller filesize | |
| 21h51min de 1 de outubro de 2010 |  | 1 072 × 933 (2,92 MB) | Htonl | Reverted to version as of 17:41, 1 October 2010 | |
| 21h33min de 1 de outubro de 2010 |  | 1 072 × 933 (2,79 MB) | Htonl | tweak | |
| 17h41min de 1 de outubro de 2010 |  | 1 072 × 933 (2,92 MB) | Htonl | use equal-area projection | |
| 18h50min de 16 de fevereiro de 2010 |  | 1 000 × 786 (2,81 MB) | Htonl | tweak | |
| 19h49min de 7 de fevereiro de 2010 |  | 1 000 × 786 (3,04 MB) | Htonl | and again | |
| 19h43min de 7 de fevereiro de 2010 |  | 1 000 × 786 (3,04 MB) | Htonl | change "none" colour | |
| 00h50min de 7 de fevereiro de 2010 |  | 1 000 × 786 (3,04 MB) | Htonl | =={{int:filedesc}}== {{Information |Description={{en|1=Map showing the dominant homelanguages in South Africa, according to Census 2001 at the "Main Place" level. In this context, a language is dominant if it more than 50% of the population in an area spe |
Utilização local do ficheiro
Não há nenhuma página que use este ficheiro.
Utilização global do ficheiro
As seguintes wikis usam este ficheiro:
- zh.wikipedia.org