
Ficheiro:Top Oil Producing Countries.png

Dimensões desta antevisão: 551 × 600 píxeis. Outras resoluções: 221 × 240 píxeis | 441 × 480 píxeis | 681 × 741 píxeis.
Imagem numa resolução maior (681 × 741 píxeis, tamanho: 28 kB, tipo MIME: image/png)
|
|
Esta imagem provém do Wikimedia Commons, um acervo de conteúdo livre da Wikimedia Foundation que pode ser utilizado por outros projetos.
|
Descrição do ficheiro
| Descrição |
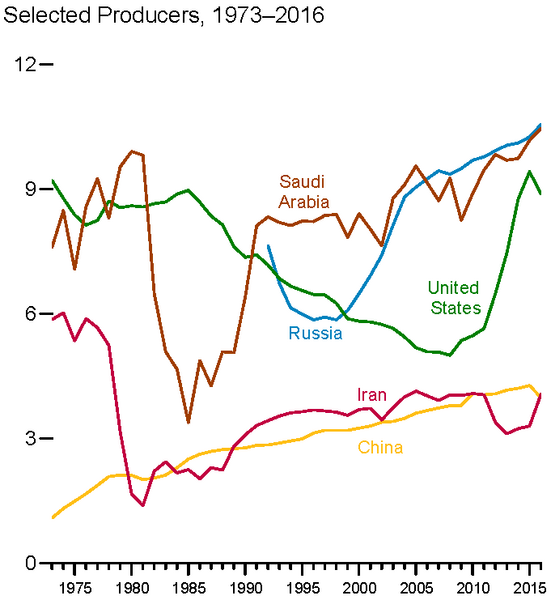
Top Oil-Producing Countries (Crude Oil including Gas Condensate, million barrels per day, 1973–2016) |
||
| Data | |||
| Origem | https://www.eia.gov/totalenergy/data/monthly/archive/00351705.pdf (Monthly Energy Review, May 2017, Figure 11.1a) | ||
| Autor | U.S. Energy Information Administration | ||
| Outras versões |
Chart based on https://www.eia.gov/totalenergy/data/monthly/archive/00351705.pdf (Monthly Energy Review, May 2017, Table 11.1a): Note that the graph has less data than the PNG image for the years 1973-1995. The later years should be identical. |

Licenciamento
| This image is a work of a United States Department of Energy (or predecessor organization) employee, taken or made as part of that person's official duties. As a work of the U.S. federal government, the image is in the public domain.
Please note that national laboratories operate under varying licences and some are not free. Check the site policies of any national lab before crediting it with this tag.
|

|
Histórico do ficheiro
Clique uma data e hora para ver o ficheiro tal como ele se encontrava nessa altura.
| Data e hora | Miniatura | Dimensões | Utilizador | Comentário | |
|---|---|---|---|---|---|
| atual | 23h01min de 28 de maio de 2017 | | 681 × 741 (28 kB) | Patrug | another year of data |
| 18h41min de 1 de maio de 2016 |  | 701 × 753 (27 kB) | Patrug | another year of data | |
| 00h07min de 6 de dezembro de 2015 |  | 677 × 734 (26 kB) | Patrug | 9 years of newer data | |
| 19h24min de 26 de janeiro de 2008 |  | 465 × 472 (32 kB) | Halgin | {{Information |Description= Top Oil Producing Counties 1960-2006 |Source= Energy Information Administration / Annual Energy Review 2006 |Date= July 2007 |Author= US Department of Energy, Energy Information Administration |Permission= |other_versions= }} |
Utilização local do ficheiro
A seguinte página usa este ficheiro:
Utilização global do ficheiro
As seguintes wikis usam este ficheiro:
- ar.wikipedia.org
- ca.wikipedia.org
- cs.wikipedia.org
- el.wikipedia.org
- en.wikipedia.org
- en.wikibooks.org
- eo.wikipedia.org
- es.wikipedia.org
- eu.wikipedia.org
- fa.wikipedia.org
- fi.wikipedia.org
- hy.wikipedia.org
- id.wikipedia.org
- kk.wikipedia.org
- ko.wikipedia.org
- ml.wikipedia.org
- ms.wikipedia.org
- my.wikipedia.org
- ne.wikipedia.org
- pl.wikipedia.org
- pl.wiktionary.org
- ru.wikipedia.org
- simple.wikipedia.org
- sl.wikipedia.org
- th.wikipedia.org
- tr.wikipedia.org
- uk.wikipedia.org
- uz.wikipedia.org
- vec.wikipedia.org
- vi.wikipedia.org
- www.wikidata.org
- zh.wikipedia.org
Ver mais utilizações globais deste ficheiro.